Global sea surface temperatures April 2023
Bildnummer 14077545
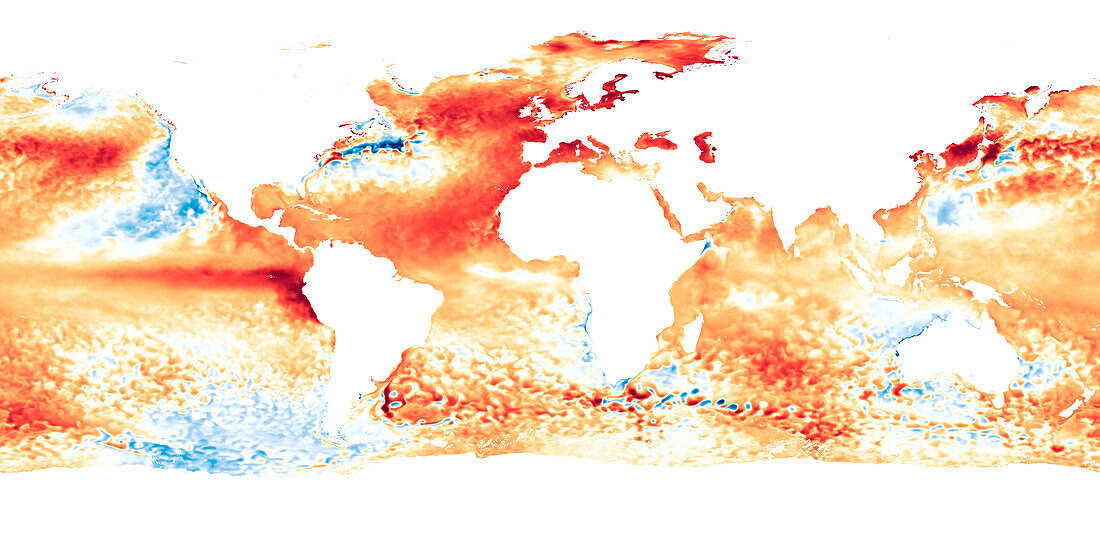
| Map displaying the global sea surface temperatures in April 2023. The colours on the map indicate how much the monthly sea surface temperature differs from the long-term average (1985-1993). The red areas indicate warmer-than-average temperatures, while the blue areas indicate cooler-than-average temperatures. The darker the colour, the more significant the difference from the long-term average. White and very light areas indicate near-average temperatures. An above-average sea surface temperature in the central and eastern Pacific is one of the indicators of El Nino conditions, which is the warm phase of a major climate pattern called the El Nino Southern Oscillation (ENSO). Though every ENSO cycle is different, El Nino tends to increase global temperatures an average of 0.2 degrees. However, this cycle is occurring in the context of an already very warm global ocean and scientists do not yet know how this will affect El Nino's atmospheric conditions. Data obtained from the NOAA Coral Reef Watch. | |
| Lizenzart: | Lizenzpflichtig |
| Credit: | Science Photo Library / NOAA |
| Bildgröße: | 7200 px × 3600 px |
| Modell-Rechte: | nicht erforderlich |
| Eigentums-Rechte: | nicht erforderlich |
| Restrictions: |
|
Preise für dieses Bild ab 15 €
Universitäten & Organisationen
(Informationsmaterial Digital, Informationsmaterial Print, Lehrmaterial Digital etc.)
ab 15 €
Redaktionell
(Bücher, Bücher: Sach- und Fachliteratur, Digitale Medien (redaktionell) etc.)
ab 30 €
Werbung
(Anzeigen, Aussenwerbung, Digitale Medien, Fernsehwerbung, Karten, Werbemittel, Zeitschriften etc.)
ab 55 €
Handelsprodukte
(bedruckte Textilie, Kalender, Postkarte, Grußkarte, Verpackung etc.)
ab 75 €
Pauschalpreise
Rechtepakete für die unbeschränkte Bildnutzung in Print oder Online
ab 495 €
Keywords
- 2000er Jahre,
- 21. Jahrhundert,
- Afrika,
- April,
- Asien,
- Australien,
- El Nino,
- Enso,
- Erdbeobachtung,
- Europa,
- Globale Erwärmung,
- Globus,
- Karte,
- Klima,
- Klimatologie,
- klimatologisch,
- Klimawandel,
- Lateinamerika,
- Meer,
- Meteorologie,
- meteorologisch,
- Niemand,
- NOAA,
- Nordamerika,
- Ozean,
- sst,
- Südamerika,
- Temperatur,
- Umwelt,
- Umweltwissenschaften,
- Welt,
- weltweit,
- Wetter