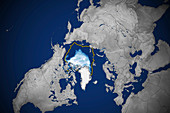
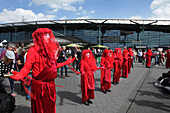
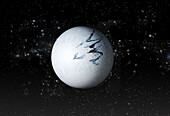
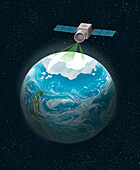
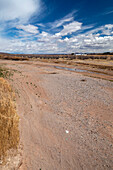
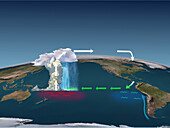
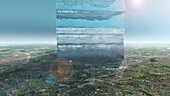
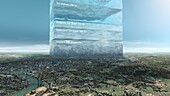
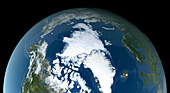
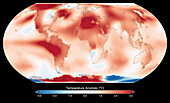
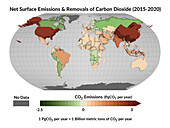
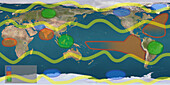
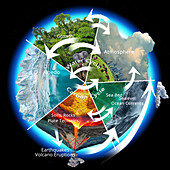
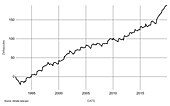
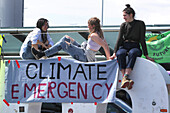
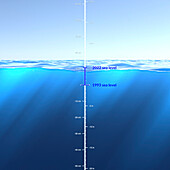
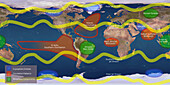
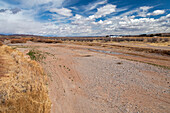
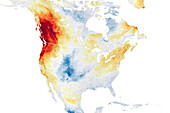
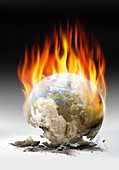
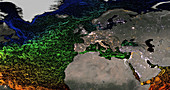
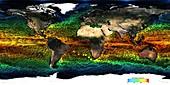
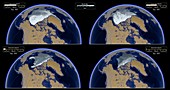
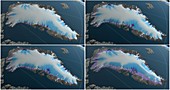
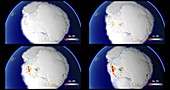
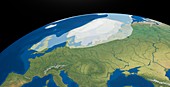
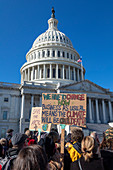
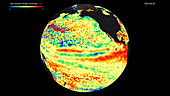
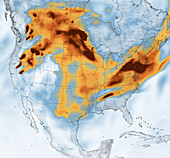
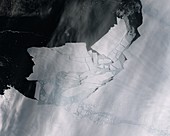
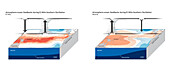
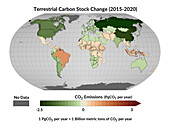
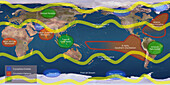
13295982 - Arctic ice minimum extent, 202013950761 - Air traffic pollution protest, Amsterdam, Netherlands13674555 - Arctic ice minimum extent, 202213618829 - Snowball earth, illustration13950829 - Ice monitoring, conceptual illustration13754744 - Dry river bed, Rio Grande, New Mexico, USA13736645 - Walker circulation, illustration13525441 - Annual ice loss compared with London, UK, illustration13525440 - Annual ice loss compared with London, UK, illustration13736530 - Global temperature anomalies, 2018-202213736526 - Baring Head Atmospheric Research Station, illustration13672684 - Global sea level rise, 1992-201913618828 - Snowball earth, illustration13601184 - Arctic sea ice maximum, February 202113525433 - Annual ice loss compared with London, UK, illustration13951830 - Antarctic sea ice, August 202313736148 - Australian heatwave, 202213672681 - Global sea level rise, 1992-201913672596 - Comparison of snow cover on Mount Fuji, Japan13525437 - Annual ice loss compared with London, UK, illustration13736520 - Earth's climate system, illustration13672682 - Global sea level rise, 1992-201913525436 - Annual ice loss compared with London, UK, illustration13525434 - Annual ice loss compared with London, UK, illustration14077525 - Artic sea ice minimum September 2023, satellite image13951827 - Global temperature anomalies, July 202313950801 - Surface emission and removal of carbon dioxide, 2015-202013736750 - Earth's climate system, illustration13672680 - Global sea level rise, 1992-201914077547 - El Nino and near global ocean warmth June 202313736646 - La Nina, illustration13525438 - Annual ice loss compared with London, UK, illustration14077545 - Global sea surface temperatures April 202313950803 - Wildfires, Rhodes, Greece, July 202313600968 - East Antarctic ice shelf, January 2022, satellite image13736751 - Earth's climate system, illustration13673250 - USA carbon dioxide urban emission13672683 - Global sea level rise, 1992-201914077535 - Monthly sea surface temperatures using Nino 3.4 Index13736160 - Great Barrier Reef mass bleaching event14077546 - El Nino climate pattern June 199713736756 - Climate tipping points, illustration13736521 - Earth's climate system, illustration13950796 - Ocean warming, 1992-201913950760 - Air traffic pollution protest, Amsterdam, Netherlands13736522 - Earth's climate system, illustration13672686 - Global sea level rise, 1992-201914077523 - Antarctic sea ice maximum September 2023, satellite image13951828 - Global temperature anomalies, July 202313950570 - Developing El nino, April 202313672687 - Global sea surface salinity, 2011-202113600969 - Collapsed East Antarctic ice shelf, satellite image13736754 - Baring Head Atmospheric Research Station, illustration13674556 - Global methane emissions from fossil fuel, 201613673165 - Carbon dioxide urban emissions over Europe and Asia13525435 - Annual land ice loss compared with London, UK, illustration13355468 - Aerosols from US Pacific Coast wildfires, September 202013272352 - Global warming, conceptual illustration12991346 - Extinction Rebellion demonstration, 201912960545 - Climate change protest, Washington DC, USA14077550 - Global average sea level rise 1993-202213839410 - Climate tipping points, illustration13839408 - Climate tipping points, illustration13754746 - Dry river bed, Rio Grande, New Mexico, USA13672685 - Global sea level rise, 1992-201913444859 - British Columbia wildfire, June 202113377679 - Solar radiation and global warming, illustration13358532 - Cumulonimbus Cloud13355984 - California heatwave, September 202013258419 - Global atmospheric carbon removal by plants, winter 200012991477 - Wildfire in Greenland in August 2017, satellite image12991391 - Sentinel 6 Michael Freilich satellite12991389 - Sentinel 6 Michael Freilich satellite12991382 - Larsen C iceberg, 2017 and 2018, satellite images12947458 - Climate change on a prehistoric Earth, illustration14077551 - Global average sea level rise 1993-202213952052 - Syukuro Manabe, Japanese-US meteorologist, illustration13950798 - Global temperature anomalies, June 202313672372 - Deforestation in Bolivia, satellite image13647651 - Eastern hemisphere heatwave, July 202213601183 - Arctic ice minimum extent, 202113436140 - Pacific Northwest heatwave, June 202113387550 - Global warming, conceptual illustration13258415 - North Atlantic sea surface temperatures13258413 - Global sea surface temperatures13258409 - Age distribution of Arctic Ice, 1992-201913258402 - Greenland glacier ice melt models13258393 - Antarctic land ice winter fluctuations, 1993-201712987300 - European Upper Palaeolithic glaciation, illustration12960541 - Climate change protest, Washington DC, USA14077539 - Sea surface height anomaly June 202313673552 - Sentinel-6 Michael Freilich satellite undergoing testing13444863 - Wildfire smoke over North America, July 202113368740 - Tabular icebergs from Larson C ice shelf, Antarctica13356931 - Siberian wildfires, June 2020, satellite image13258754 - Iceberg calved from Pine Island Glacier, Antarctica14077534 - Atmosphere-ocean feedback during El Nino, composite image13950800 - Terrestrial carbon stock changes, 2015-202013839409 - Climate tipping points, illustrationnächste Seite