Global sea surface temperature anomalies, August 2023
Bildnummer 13952311
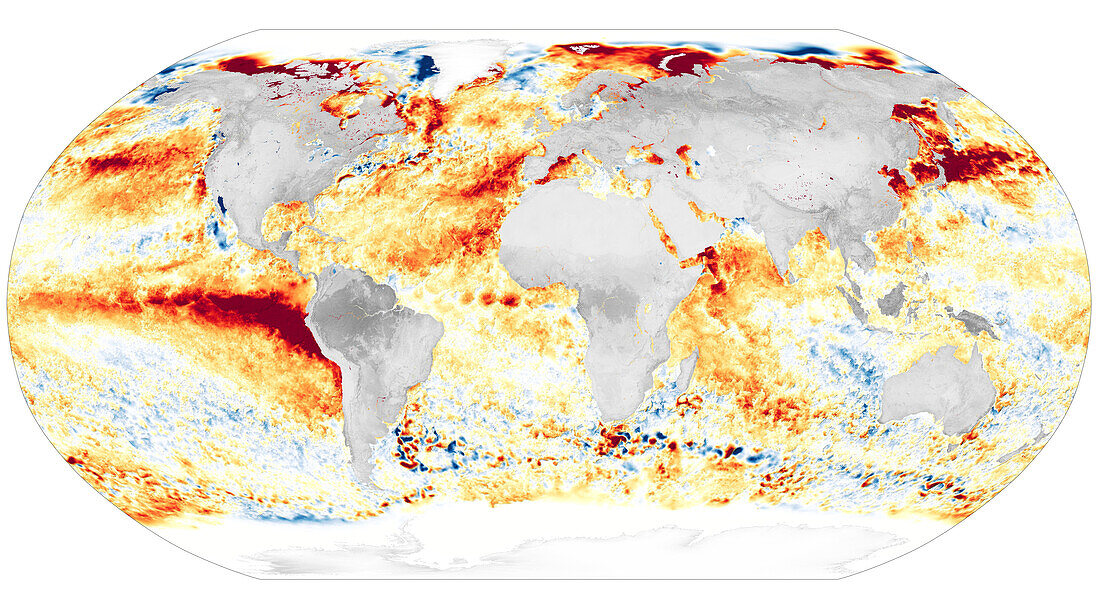
| Global sea surface temperature anomalies, 21st August 2023. This image shows the sea surface temperature anomalies on 21st August 2023 compared to the 2003-2014 average for that day. Areas that are hotter than normal are red, those that are cooler are blue. The four months up to August had set records for sea surface temperatures and this trend continued into August. This warming is thought to be driven by the El Nino weather phenomenon and human-induced climate change. Data from the Multiscale Ultrahigh Resolution Sea Surface Temperature (MUR SST) project. | |
| Lizenzart: | Lizenzpflichtig |
| Credit: | Science Photo Library / MUR project / NASA Earth Observatory |
| Bildgröße: | 3970 px × 2206 px |
| Modell-Rechte: | nicht erforderlich |
| Eigentums-Rechte: | nicht erforderlich |
| Restrictions: | - |
Preise für dieses Bild ab 15 €
Universitäten & Organisationen
(Informationsmaterial Digital, Informationsmaterial Print, Lehrmaterial Digital etc.)
ab 15 €
Redaktionell
(Bücher, Bücher: Sach- und Fachliteratur, Digitale Medien (redaktionell) etc.)
ab 30 €
Werbung
(Anzeigen, Aussenwerbung, Digitale Medien, Fernsehwerbung, Karten, Werbemittel, Zeitschriften etc.)
ab 55 €
Handelsprodukte
(bedruckte Textilie, Kalender, Postkarte, Grußkarte, Verpackung etc.)
ab 75 €
Pauschalpreise
Rechtepakete für die unbeschränkte Bildnutzung in Print oder Online
ab 495 €