USA carbon dioxide urban emission
Bildnummer 13673250
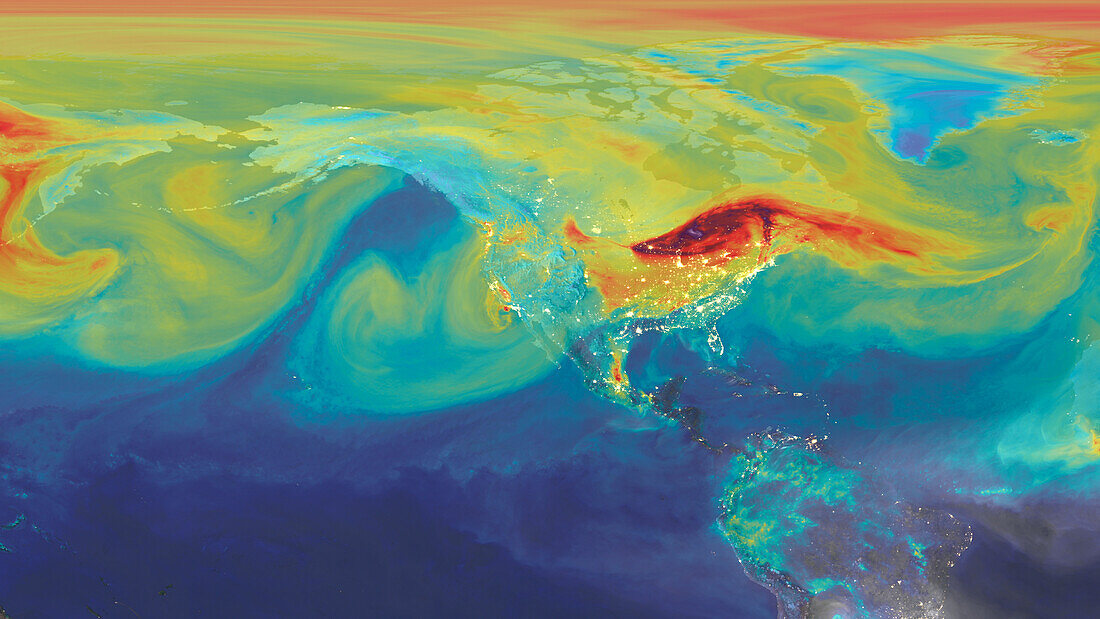
| Map showing USA carbon dioxide urban emission. Areas with high carbon dioxide emissions are in red and low carbon dioxide emissions are blue. Data based on NASA observations. | |
| Lizenzart: | Lizenzpflichtig |
| Credit: | Science Photo Library / Animate4.com |
| Bildgröße: | 5580 px × 3139 px |
| Modell-Rechte: | nicht erforderlich |
| Eigentums-Rechte: | nicht erforderlich |
| Restrictions: | - |
Preise für dieses Bild ab 15 €
Universitäten & Organisationen
(Informationsmaterial Digital, Informationsmaterial Print, Lehrmaterial Digital etc.)
ab 15 €
Redaktionell
(Bücher, Bücher: Sach- und Fachliteratur, Digitale Medien (redaktionell) etc.)
ab 30 €
Werbung
(Anzeigen, Aussenwerbung, Digitale Medien, Fernsehwerbung, Karten, Werbemittel, Zeitschriften etc.)
ab 55 €
Handelsprodukte
(bedruckte Textilie, Kalender, Postkarte, Grußkarte, Verpackung etc.)
ab 75 €
Pauschalpreise
Rechtepakete für die unbeschränkte Bildnutzung in Print oder Online
ab 495 €
Keywords
- Amerikanisch,
- Atmosphäre,
- atmosphärisch,
- Distribution,
- Erde,
- geografisch,
- Geographie,
- Globale Erwärmung,
- Karte,
- Klimatologie,
- klimatologisch,
- Klimawandel,
- Kohlendioxid,
- Kohlenstoff,
- Niemand,
- Nordamerika,
- nordamerikanisch,
- nördliche Hemisphäre,
- Treibhausgas,
- Umwelt,
- Umweltwissenschaften,
- USA,
- Vereinigte Staaten,
- Verschmutzung