Carbon dioxide urban emissions over Europe and Asia
Bildnummer 13673165
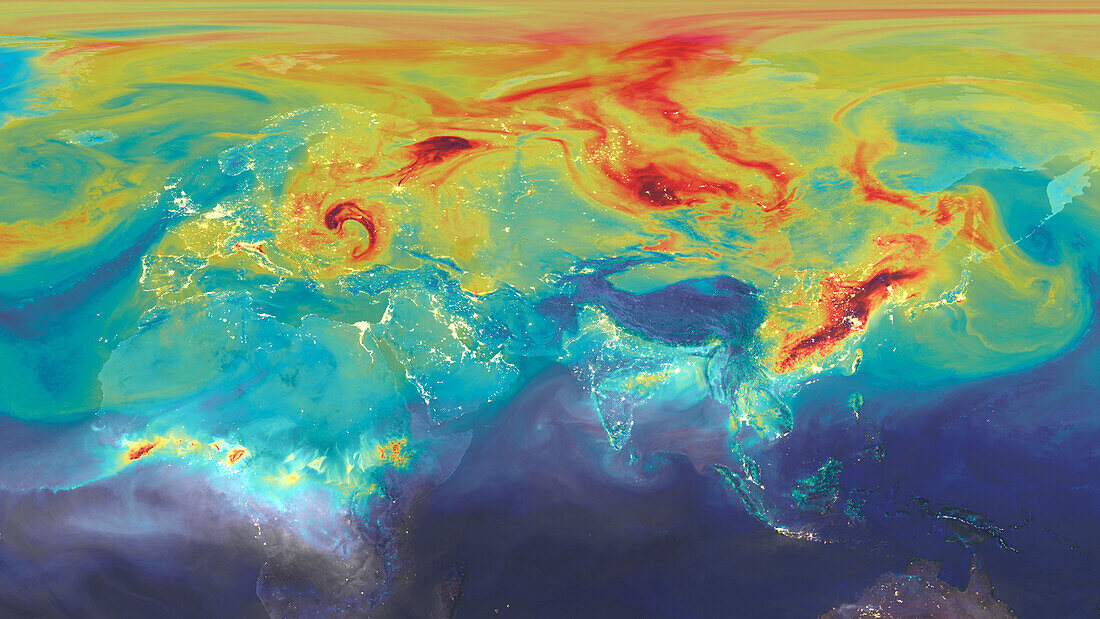
| Map showing carbon dioxide urban emissions over Europe and Asia. Areas with high carbon dioxide emissions are in red and low carbon dioxide emissions are blue. Data based on NASA observations. | |
| Lizenzart: | Lizenzpflichtig |
| Credit: | Science Photo Library / Animate4.com |
| Bildgröße: | 5580 px × 3139 px |
| Modell-Rechte: | nicht erforderlich |
| Eigentums-Rechte: | nicht erforderlich |
| Restrictions: | - |
Preise für dieses Bild ab 15 €
Universitäten & Organisationen
(Informationsmaterial Digital, Informationsmaterial Print, Lehrmaterial Digital etc.)
ab 15 €
Redaktionell
(Bücher, Bücher: Sach- und Fachliteratur, Digitale Medien (redaktionell) etc.)
ab 30 €
Werbung
(Anzeigen, Aussenwerbung, Digitale Medien, Fernsehwerbung, Karten, Werbemittel, Zeitschriften etc.)
ab 55 €
Handelsprodukte
(bedruckte Textilie, Kalender, Postkarte, Grußkarte, Verpackung etc.)
ab 75 €
Pauschalpreise
Rechtepakete für die unbeschränkte Bildnutzung in Print oder Online
ab 495 €