Antarctic land ice fluctuations, 1993-2017
Bildnummer 13258392
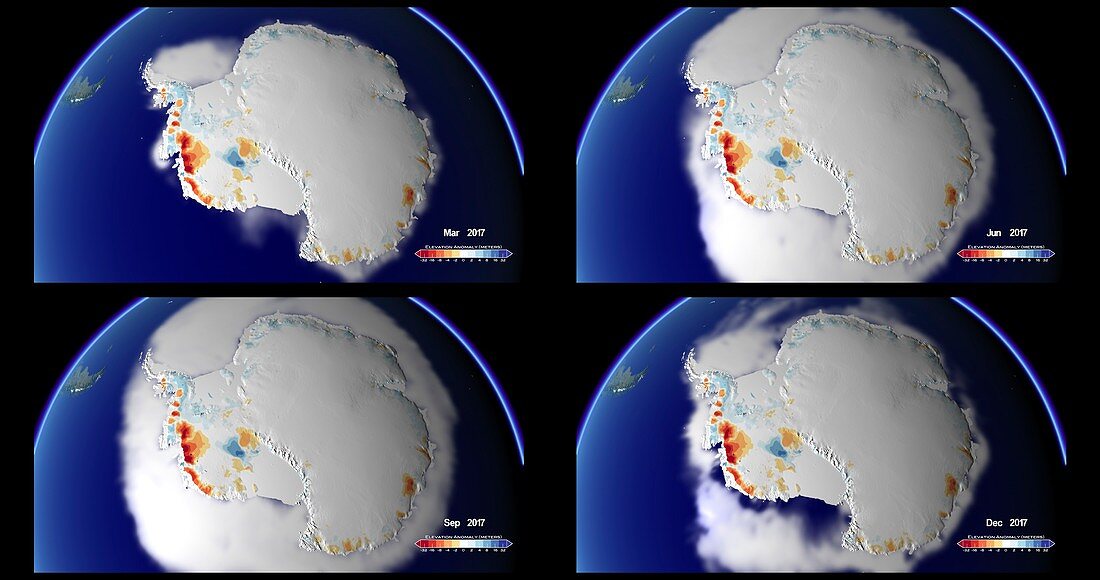
| Computer models showing Antarctic land ice fluctuations for the months of March, June, September and December, between 1993 and 2017. Red areas show ice loss, through melting, while blue areas show ice gains. The west Antarctic coast (left) has see the largest loss of ice. | |
| Lizenzart: | Lizenzpflichtig |
| Credit: | Science Photo Library / NASA Scientific Visualisation Studio |
| Bildgröße: | 4096 px × 2160 px |
| Modell-Rechte: | nicht erforderlich |
| Eigentums-Rechte: | nicht erforderlich |
| Restrictions: | - |
Preise für dieses Bild ab 15 €
Universitäten & Organisationen
(Informationsmaterial Digital, Informationsmaterial Print, Lehrmaterial Digital etc.)
ab 15 €
Redaktionell
(Bücher, Bücher: Sach- und Fachliteratur, Digitale Medien (redaktionell) etc.)
ab 30 €
Werbung
(Anzeigen, Aussenwerbung, Digitale Medien, Fernsehwerbung, Karten, Werbemittel, Zeitschriften etc.)
ab 55 €
Handelsprodukte
(bedruckte Textilie, Kalender, Postkarte, Grußkarte, Verpackung etc.)
ab 75 €
Pauschalpreise
Rechtepakete für die unbeschränkte Bildnutzung in Print oder Online
ab 495 €
Keywords
- 2017,
- 21. Jahrhundert,
- Antarktis,
- Dezember,
- Erdbeobachtung,
- Erde,
- geografisch,
- Geographie,
- Globale Erwärmung,
- Illustration,
- Juni,
- Karte,
- Klimatologie,
- klimatologisch,
- Klimawandel,
- Kontinent,
- Küste,
- Küsten-,
- März,
- Modell-,
- Modelle,
- Niemand,
- polar,
- Schmelzen,
- Schwankungen,
- schwarzer Hintergrund,
- September,
- Südpol,
- Umwelt,
- Umweltwissenschaften,
- Veränderung,
- Weltall,
- Westküste