21st century temperature change models
Bildnummer 13258391
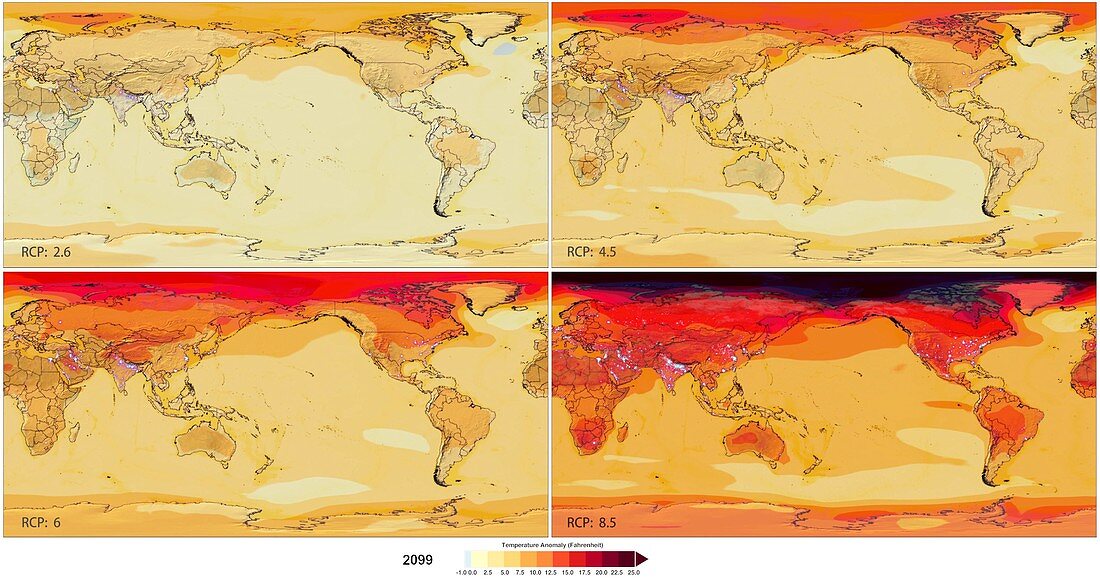
| 21st century temperature change models based on four different global warming scenarios. The models show changes in temperature in degrees Fahrenheit compared to the average temperature from 1970 to 2000. The four models are based on Representative Concentration Pathways (RCPS), which are greenhouse gas concentration trajectories. Across top and then bottom the RCPs are: 2.6, 4.5, 6, and 8.5. Each number represents the expected Watts per meter squared of heat energy trapped by the climate system. Urban distribution data is also shown, giving an idea of the impact of the changes on human populations. | |
| Lizenzart: | Lizenzpflichtig |
| Credit: | Science Photo Library / Nasa Goddard Space Flight Center Scientific Visualisation Studio and IPCC community |
| Bildgröße: | 5757 px × 3036 px |
| Modell-Rechte: | nicht erforderlich |
| Eigentums-Rechte: | nicht erforderlich |
| Restrictions: | - |
Preise für dieses Bild ab 15 €
Universitäten & Organisationen
(Informationsmaterial Digital, Informationsmaterial Print, Lehrmaterial Digital etc.)
ab 15 €
Redaktionell
(Bücher, Bücher: Sach- und Fachliteratur, Digitale Medien (redaktionell) etc.)
ab 30 €
Werbung
(Anzeigen, Aussenwerbung, Digitale Medien, Fernsehwerbung, Karten, Werbemittel, Zeitschriften etc.)
ab 55 €
Handelsprodukte
(bedruckte Textilie, Kalender, Postkarte, Grußkarte, Verpackung etc.)
ab 75 €
Pauschalpreise
Rechtepakete für die unbeschränkte Bildnutzung in Print oder Online
ab 495 €