Global temperature anomalies,2015-2019
Bildnummer 12960925
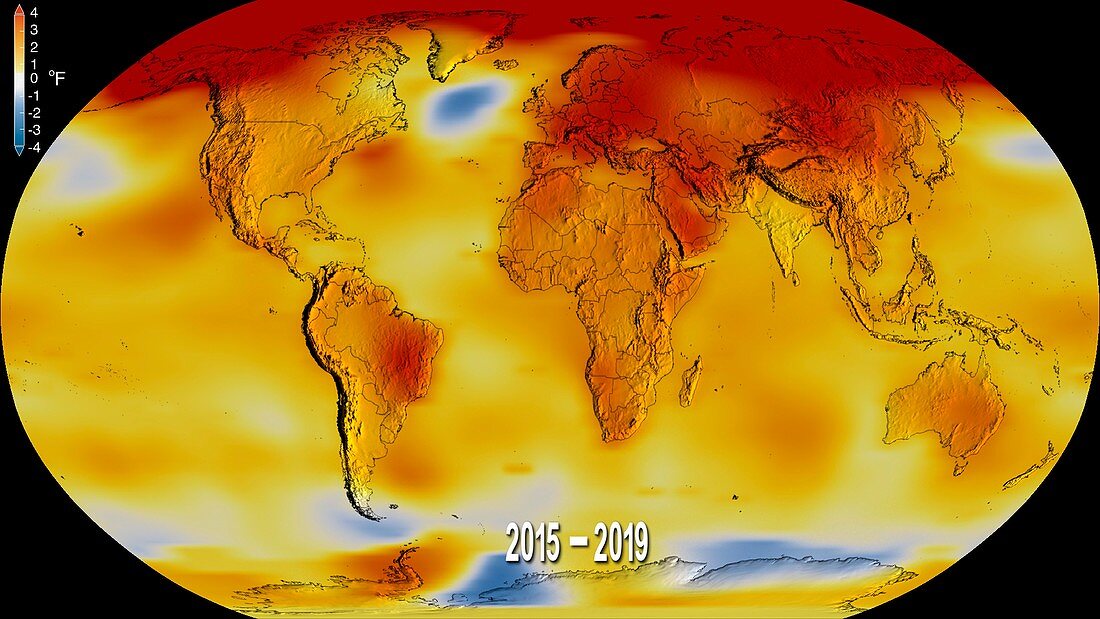
| Global temperature anomalies,2015-2019. This image shows the average land and sea surface temperatures from 2015-2019,compared to the 1951-1980 average. Areas that are hotter than normal are red,those that are cooler are blue. 2016 was the warmest year since modern record-keeping began in 1880 and the five years shown here were the warmest of the past 140 years. Scientists attribute this warming to increased carbon dioxide and other greenhouse gases in the atmosphere due to human activity. | |
| Lizenzart: | Lizenzpflichtig |
| Credit: | Science Photo Library / NASA Earth Observatory |
| Bildgröße: | 4000 px × 2250 px |
| Modell-Rechte: | nicht erforderlich |
| Eigentums-Rechte: | nicht erforderlich |
| Restrictions: | - |
Preise für dieses Bild ab 15 €
Universitäten & Organisationen
(Informationsmaterial Digital, Informationsmaterial Print, Lehrmaterial Digital etc.)
ab 15 €
Redaktionell
(Bücher, Bücher: Sach- und Fachliteratur, Digitale Medien (redaktionell) etc.)
ab 30 €
Werbung
(Anzeigen, Aussenwerbung, Digitale Medien, Fernsehwerbung, Karten, Werbemittel, Zeitschriften etc.)
ab 55 €
Handelsprodukte
(bedruckte Textilie, Kalender, Postkarte, Grußkarte, Verpackung etc.)
ab 75 €
Pauschalpreise
Rechtepakete für die unbeschränkte Bildnutzung in Print oder Online
ab 495 €
Keywords
- 2000er Jahre,
- 2015,
- 2019,
- 21. Jahrhundert,
- abnormal,
- Afrika,
- Antarktis,
- Arktis,
- Asiatisch,
- Asien,
- Erdbeobachtung,
- Eurasien,
- Europa,
- europäisch,
- geografisch,
- Geographie,
- Globale Erwärmung,
- Grafik,
- Illustration,
- Klima,
- Klimatologie,
- klimatologisch,
- Klimawandel,
- Kunstwerk,
- Lateinamerika,
- Meteorologie,
- meteorologisch,
- Modell-,
- Niemand,
- Nordamerika,
- nordamerikanisch,
- Ozeanien,
- Robinson-Projektion,
- schwarzer Hintergrund,
- Südamerika,
- Umwelt,
- weltweit,
- Zentralamerika