Carbon footprints of North American cities, satellite map
Bildnummer 12947686
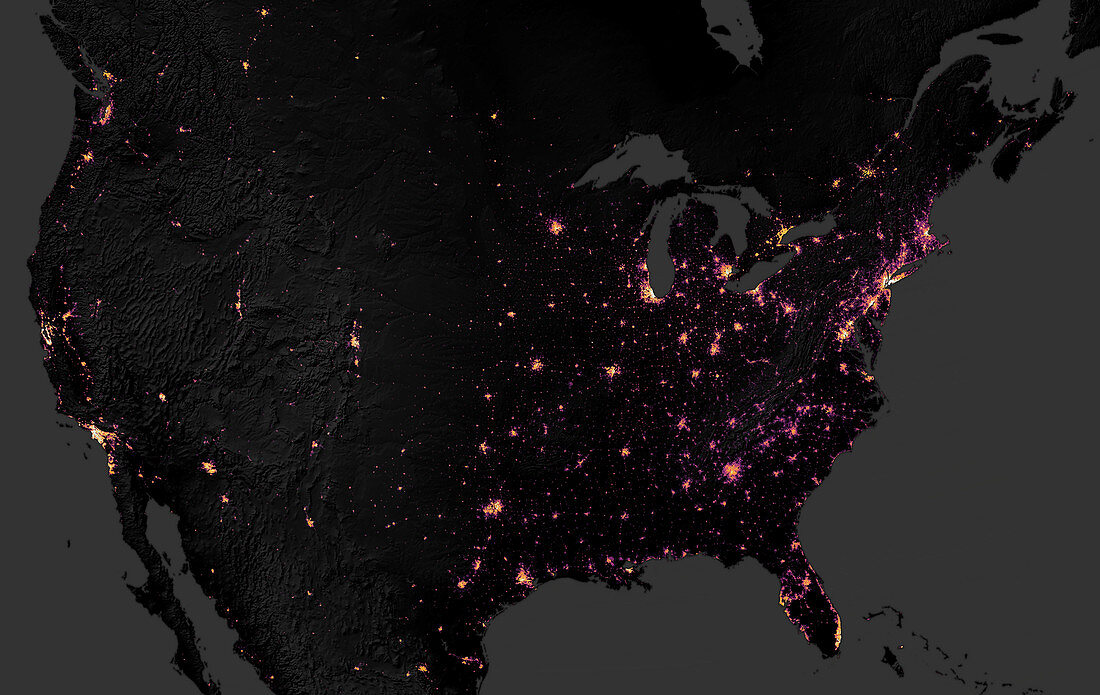
| Carbon footprints of North American cities. Map based on satellite data of carbon dioxide (CO2) emissions from cities in North America. This image combines data from the Global Human Settlement Layer (GHSL) with observations with the Operational Land Imager (OLI) on the Landsat 8 satellite. The CO2 levels are colour-coded from black and purple (low) through pink, red, orange and yellow to white (high). Major US cities shown here include Los Angeles, Chicago and New York. This map uses data from 2013. | |
| Lizenzart: | Lizenzpflichtig |
| Credit: | Science Photo Library / NASA Earth Observatory |
| Bildgröße: | 5258 px × 3324 px |
| Modell-Rechte: | nicht erforderlich |
| Eigentums-Rechte: | nicht erforderlich |
| Restrictions: | - |
Preise für dieses Bild ab 15 €
Universitäten & Organisationen
(Informationsmaterial Digital, Informationsmaterial Print, Lehrmaterial Digital etc.)
ab 15 €
Redaktionell
(Bücher, Bücher: Sach- und Fachliteratur, Digitale Medien (redaktionell) etc.)
ab 30 €
Werbung
(Anzeigen, Aussenwerbung, Digitale Medien, Fernsehwerbung, Karten, Werbemittel, Zeitschriften etc.)
ab 55 €
Handelsprodukte
(bedruckte Textilie, Kalender, Postkarte, Grußkarte, Verpackung etc.)
ab 75 €
Pauschalpreise
Rechtepakete für die unbeschränkte Bildnutzung in Print oder Online
ab 495 €
Keywords
- 2013,
- 21. Jahrhundert,
- Amerikanisch,
- bewohnt,
- Chicago,
- CO2-Fußabdruck,
- Dichte,
- Dunkel,
- entwickelt,
- Erdbeobachtung,
- geografisch,
- Globale Erwärmung,
- Karte,
- Klimatologie,
- klimatologisch,
- Klimawandel,
- Kohlendioxid,
- Kontinent,
- künstlich,
- Landsat 8,
- Los Angeles,
- menschliche Geografie,
- Nacht,
- Nachtzeit,
- New York,
- Niemand,
- Nordamerika,
- nordamerikanisch,
- oli,
- Satellit,
- Satellitenbild,
- Stadt,
- Städte,
- städtisch,
- technologisch,
- Treibhausgas,
- uns,
- USA,
- Vereinigte Staaten,
- Weltall