Scientist with graph of atmospheric CO2 1958-1989
Bildnummer 12000398
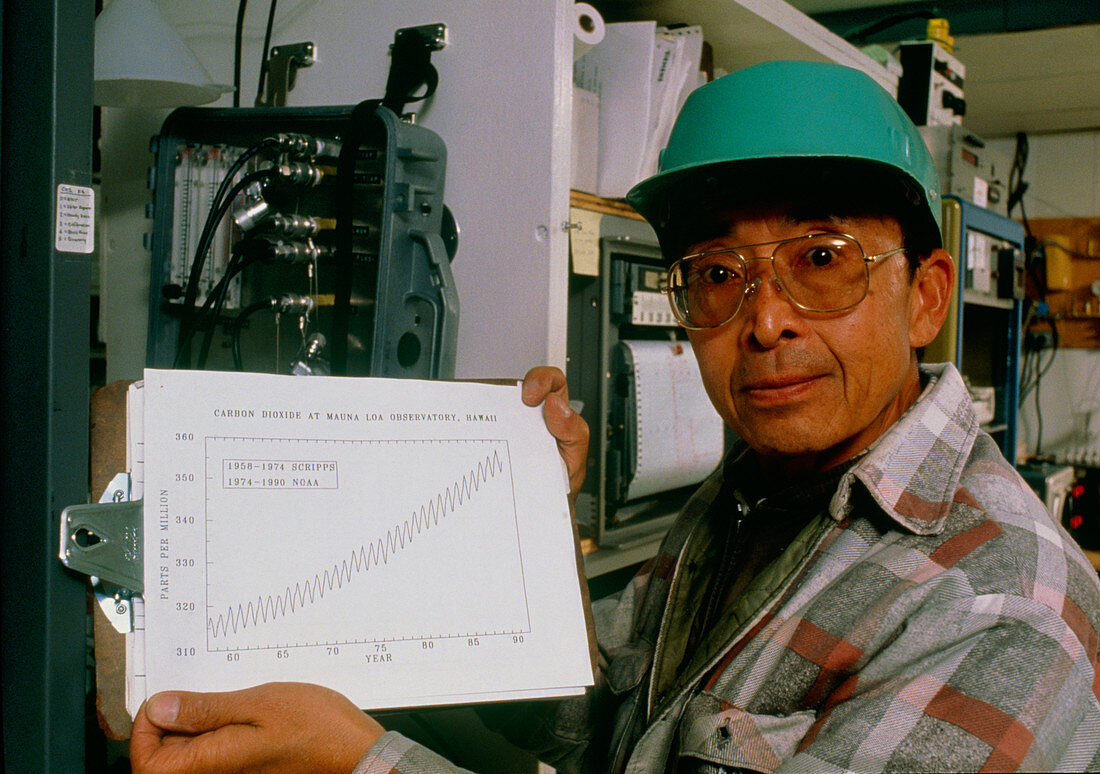
| Greenhouse Effect research. A climate physicist with a ''Keeling Curve'',a graph showing the concentration of atmospheric carbon dioxide (CO2) in the years 1958-1989 as measured at an altitude of 4170 meters on Mauna Loa,Hawaii. There are two main features to the graph. First,there is an obvious upward trend,the annual peak concentration rising from 318 parts per million (ppm) in 1958 to 356 ppm in 1989. There is also an annual variation of about 5ppm between spring (maximum) and autumn. The graph is named after Charles Keeling (b.1928),discoverer of the trend. CO2 is the main 'greenhouse gas',thought to be the cause of global warming | |
| Lizenzart: | Lizenzpflichtig |
| Credit: | Science Photo Library / Morgan, Hank |
| Bildgröße: | 5034 px × 3543 px |
| Modell-Rechte: | Derzeit liegt noch kein Release vor. Bitte kontaktieren Sie uns vor Verwendung. |
| Eigentums-Rechte: | nicht erforderlich |
| Restrictions: |
|
Preise für dieses Bild ab 15 €
Universitäten & Organisationen
(Informationsmaterial Digital, Informationsmaterial Print, Lehrmaterial Digital etc.)
ab 15 €
Redaktionell
(Bücher, Bücher: Sach- und Fachliteratur, Digitale Medien (redaktionell) etc.)
ab 30 €
Werbung
(Anzeigen, Aussenwerbung, Digitale Medien, Fernsehwerbung, Karten, Werbemittel, Zeitschriften etc.)
ab 55 €
Handelsprodukte
(bedruckte Textilie, Kalender, Postkarte, Grußkarte, Verpackung etc.)
ab 75 €
Pauschalpreise
Rechtepakete für die unbeschränkte Bildnutzung in Print oder Online
ab 495 €