La Nina,1999
Bildnummer 11739675
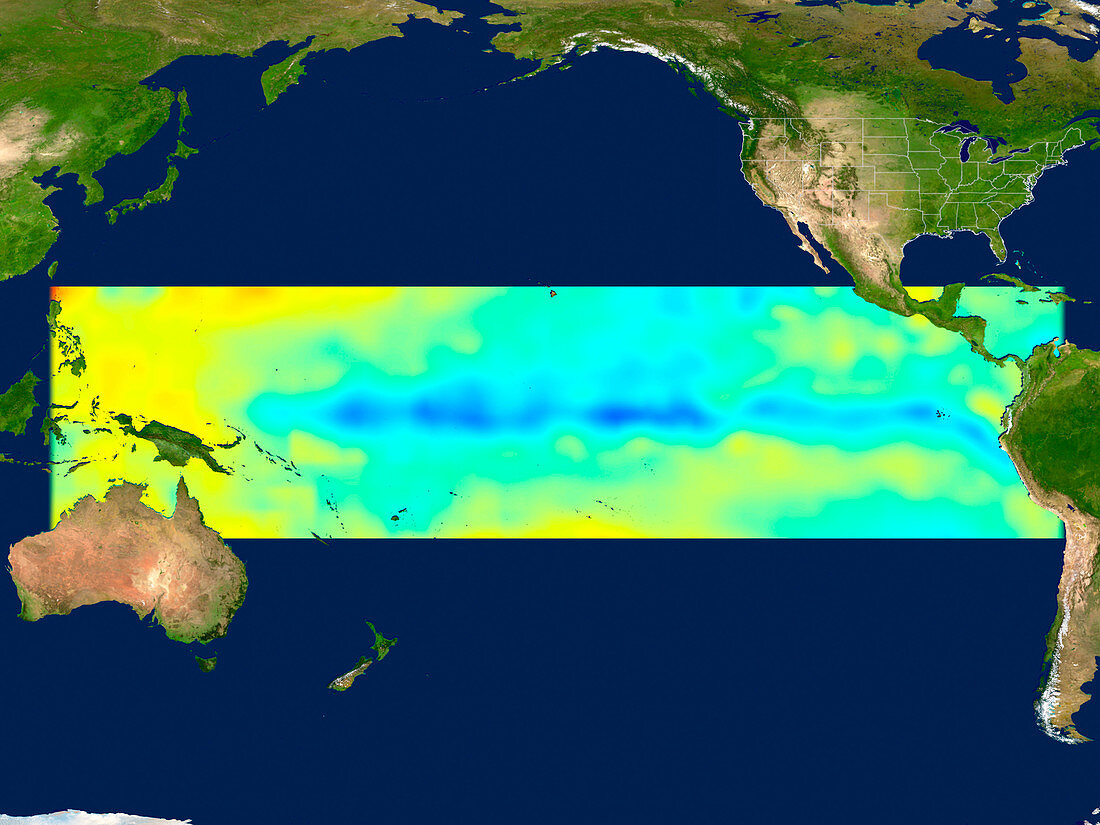
| La Nina event,1999. This sea surface temperature map,compiled from satellite data,is a frame from an animation showing conditions in the Pacific Ocean leading up to a La Nina event in 1999. Lower temperatures are shown in blue,warmer temperatures in yellow and red. A La Nina event is defined as a sustained anomaly in the ocean surface temperature where the average temperature is at least 0.5 degrees Celsius lower than usual (as opposed to an El Nino event,where the temperatures are higher than usual). The cool band can be seen stretching across the equatorial area. La Nina events can have wide-ranging effects on the global climate | |
| Lizenzart: | Lizenzpflichtig |
| Credit: | Science Photo Library / NASA |
| Bildgröße: | 3429 px × 2572 px |
| Modell-Rechte: | nicht erforderlich |
| Eigentums-Rechte: | nicht erforderlich |
| Restrictions: | - |
Preise für dieses Bild ab 15 €
Universitäten & Organisationen
(Informationsmaterial Digital, Informationsmaterial Print, Lehrmaterial Digital etc.)
ab 15 €
Redaktionell
(Bücher, Bücher: Sach- und Fachliteratur, Digitale Medien (redaktionell) etc.)
ab 30 €
Werbung
(Anzeigen, Aussenwerbung, Digitale Medien, Fernsehwerbung, Karten, Werbemittel, Zeitschriften etc.)
ab 55 €
Handelsprodukte
(bedruckte Textilie, Kalender, Postkarte, Grußkarte, Verpackung etc.)
ab 75 €
Pauschalpreise
Rechtepakete für die unbeschränkte Bildnutzung in Print oder Online
ab 495 €
Keywords
- 1900er Jahre,
- 20. Jahrhundert,
- Bedingungen,
- cool,
- Erdbeobachtung,
- Erde,
- geografisch,
- Geographie,
- Klimatologie,
- klimatologisch,
- Kondition,
- Kühlung,
- La Niña,
- Meer,
- Meereskunde,
- Meteorologie,
- meteorologisch,
- Oberfläche,
- Ozean,
- Pazifik,
- Phase,
- Rahmen,
- Satellit,
- Satellitenbild,
- sst,
- Veranstaltung,
- Weltall,
- Wetter