Global temperature anomalies 1926-1930
Bildnummer 11736463
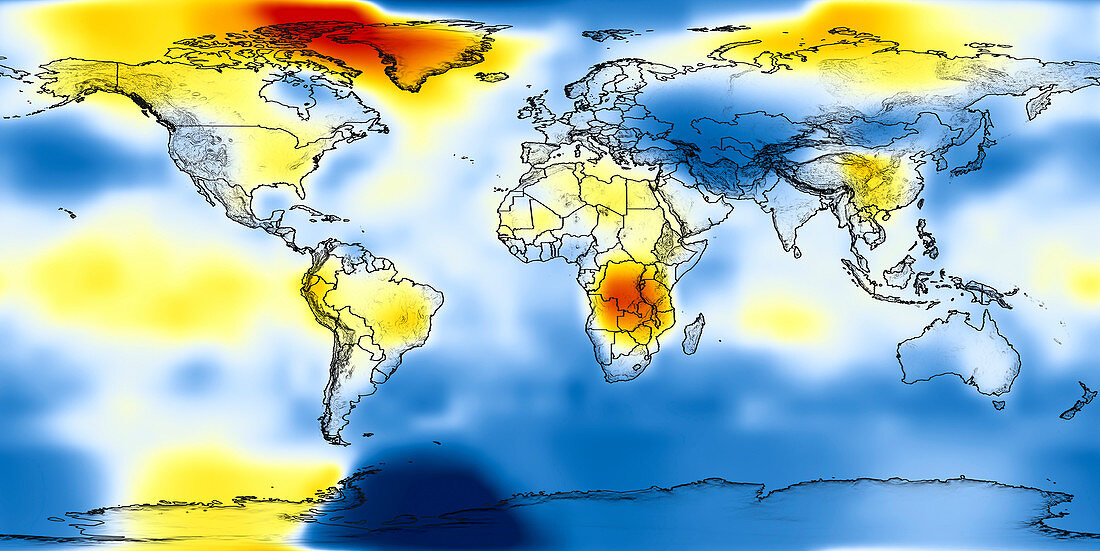
| Global temperature anomalies. Illustration showing average global temperature anomalies from 1926 to 1930. The scale runs from dark red,indicating areas warmer than average,to dark blue,indicating areas colder than average. The Arctic over North America and Asia,and South Africa were much warmer than average over this time period | |
| Lizenzart: | Lizenzpflichtig |
| Credit: | Science Photo Library / NASA |
| Bildgröße: | 4200 px × 2102 px |
| Modell-Rechte: | nicht erforderlich |
| Eigentums-Rechte: | nicht erforderlich |
| Restrictions: | - |
Preise für dieses Bild ab 15 €
Universitäten & Organisationen
(Informationsmaterial Digital, Informationsmaterial Print, Lehrmaterial Digital etc.)
ab 15 €
Redaktionell
(Bücher, Bücher: Sach- und Fachliteratur, Digitale Medien (redaktionell) etc.)
ab 30 €
Werbung
(Anzeigen, Aussenwerbung, Digitale Medien, Fernsehwerbung, Karten, Werbemittel, Zeitschriften etc.)
ab 55 €
Handelsprodukte
(bedruckte Textilie, Kalender, Postkarte, Grußkarte, Verpackung etc.)
ab 75 €
Pauschalpreise
Rechtepakete für die unbeschränkte Bildnutzung in Print oder Online
ab 495 €
Keywords
- 1900er Jahre,
- 1920er Jahre,
- 20. Jahrhundert,
- Durschnitt,
- Erde,
- Erdkunde,
- Geschichte,
- gleitender Durchschnitt,
- Globale Erwärmung,
- historisch,
- Illustration,
- Karte,
- Klima,
- klimatisch,
- Klimatologie,
- klimatologisch,
- Klimawandel,
- Kontinent,
- Kühlung,
- Kunstwerk,
- Meteorologie,
- meteorologisch,
- Oberfläche,
- Steigend,
- Temperatur,
- Welt,
- weltweit,
- Wetter,
- Wissenschaften