Global temperature anomalies 2002-2006
Bildnummer 11736457
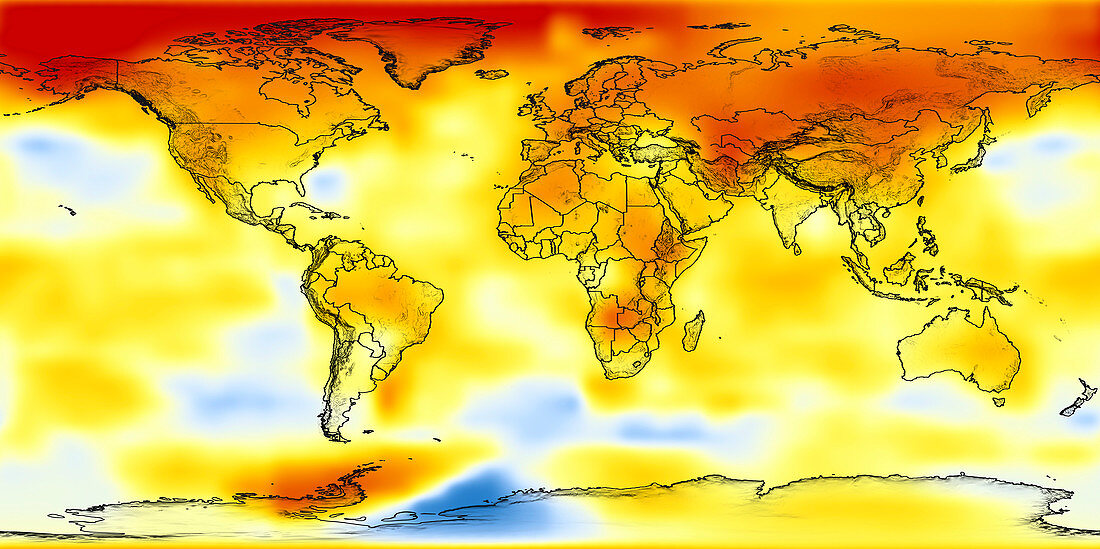
| Global temperature anomalies. Illustration showing five-year average global temperature anomalies from 2002 to 2006. The scale runs from dark red,indicating areas warmer than average,to dark blue,indicating areas colder than average. Asia and the Arctic are much warmer than average. 2005 was the warmest year since records began. These global rises in temperature could melt the polar ice caps and cause severe drought in some areas | |
| Lizenzart: | Lizenzpflichtig |
| Credit: | Science Photo Library / NASA |
| Bildgröße: | 4200 px × 2097 px |
| Modell-Rechte: | nicht erforderlich |
| Eigentums-Rechte: | nicht erforderlich |
| Restrictions: | - |
Preise für dieses Bild ab 15 €
Universitäten & Organisationen
(Informationsmaterial Digital, Informationsmaterial Print, Lehrmaterial Digital etc.)
ab 15 €
Redaktionell
(Bücher, Bücher: Sach- und Fachliteratur, Digitale Medien (redaktionell) etc.)
ab 30 €
Werbung
(Anzeigen, Aussenwerbung, Digitale Medien, Fernsehwerbung, Karten, Werbemittel, Zeitschriften etc.)
ab 55 €
Handelsprodukte
(bedruckte Textilie, Kalender, Postkarte, Grußkarte, Verpackung etc.)
ab 75 €
Pauschalpreise
Rechtepakete für die unbeschränkte Bildnutzung in Print oder Online
ab 495 €
Keywords
- 21. Jahrhundert,
- Erde,
- Erdkunde,
- Geschichte,
- gleitender Durchschnitt,
- Globale Erwärmung,
- historisch,
- Illustration,
- Karte,
- Klima,
- klimatisch,
- Klimatologie,
- klimatologisch,
- Klimawandel,
- Kontinent,
- Kunstwerk,
- Meteorologie,
- meteorologisch,
- Oberfläche,
- Steigend,
- Temperatur,
- Welt,
- weltweit,
- Wetter,
- Wissenschaften