Global NO2 pollution levels,2006
Bildnummer 11735589
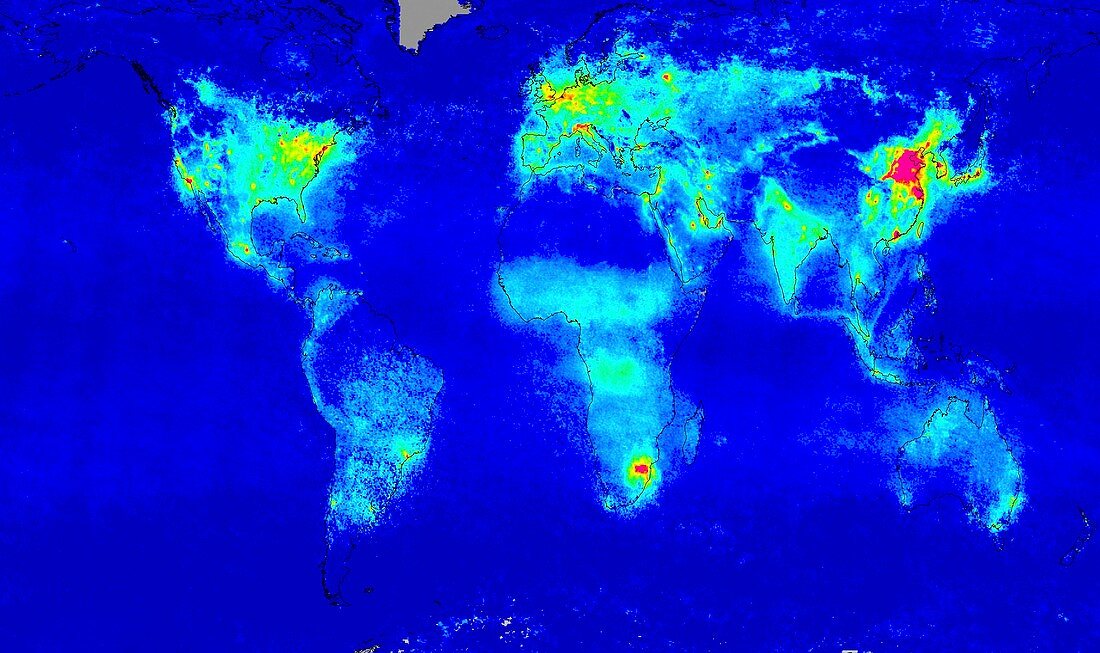
| Nitrogen dioxide pollution map. Satellite image-based map,showing the average nitrogen dioxide (NO2) produced around the world in 2006,from blue (lowest levels) to red (highest levels). NO2 is a mainly man-made gas which can cause lung damage and respiratory problems in cases of excessive exposure. NO2 also plays an important role in atmospheric chemistry as it leads to the production of ozone in the lowest part of the atmosphere (troposphere). The Scanning Imaging Absorption Spectrometer for Atmospheric Chartography (SCIAMACHY),onboard the Envisat satellite,records the spectrum of sunlight shining through the atmosphere in order to determine the amount of each gas present | |
| Lizenzart: | Lizenzpflichtig |
| Credit: | Science Photo Library / EUROPEAN SPACE AGENCY / IASB / KNMI |
| Bildgröße: | 3835 px × 2276 px |
| Modell-Rechte: | nicht erforderlich |
| Eigentums-Rechte: | nicht erforderlich |
| Restrictions: |
|
Preise für dieses Bild ab 15 €
Universitäten & Organisationen
(Informationsmaterial Digital, Informationsmaterial Print, Lehrmaterial Digital etc.)
ab 15 €
Redaktionell
(Bücher, Bücher: Sach- und Fachliteratur, Digitale Medien (redaktionell) etc.)
ab 30 €
Werbung
(Anzeigen, Aussenwerbung, Digitale Medien, Fernsehwerbung, Karten, Werbemittel, Zeitschriften etc.)
ab 55 €
Handelsprodukte
(bedruckte Textilie, Kalender, Postkarte, Grußkarte, Verpackung etc.)
ab 75 €
Pauschalpreise
Rechtepakete für die unbeschränkte Bildnutzung in Print oder Online
ab 495 €
Keywords
- 21. Jahrhundert,
- Atmosphäre,
- atmosphärisch,
- entwickelt,
- Entwicklung,
- Erdbeobachtung,
- Erde,
- Erdkunde,
- Gas,
- Gase,
- geografisch,
- Geographie,
- globale Daten,
- Industrie,
- Karte,
- Klimatologie,
- klimatologisch,
- Klimawandel,
- Meteorologie,
- meteorologisch,
- NO2,
- planetarisch,
- Satellit,
- Satellitenbild,
- sauber,
- Schadstoff,
- Sonnenlicht,
- Spektrometer,
- Spektrum,
- Umwelt,
- verschmutzt,
- Verschmutzung,
- Welt,
- weltweit,
- Wetter,
- Wissenschaften