Mauna Loa CO2 record,1958-2015
Bildnummer 11731097
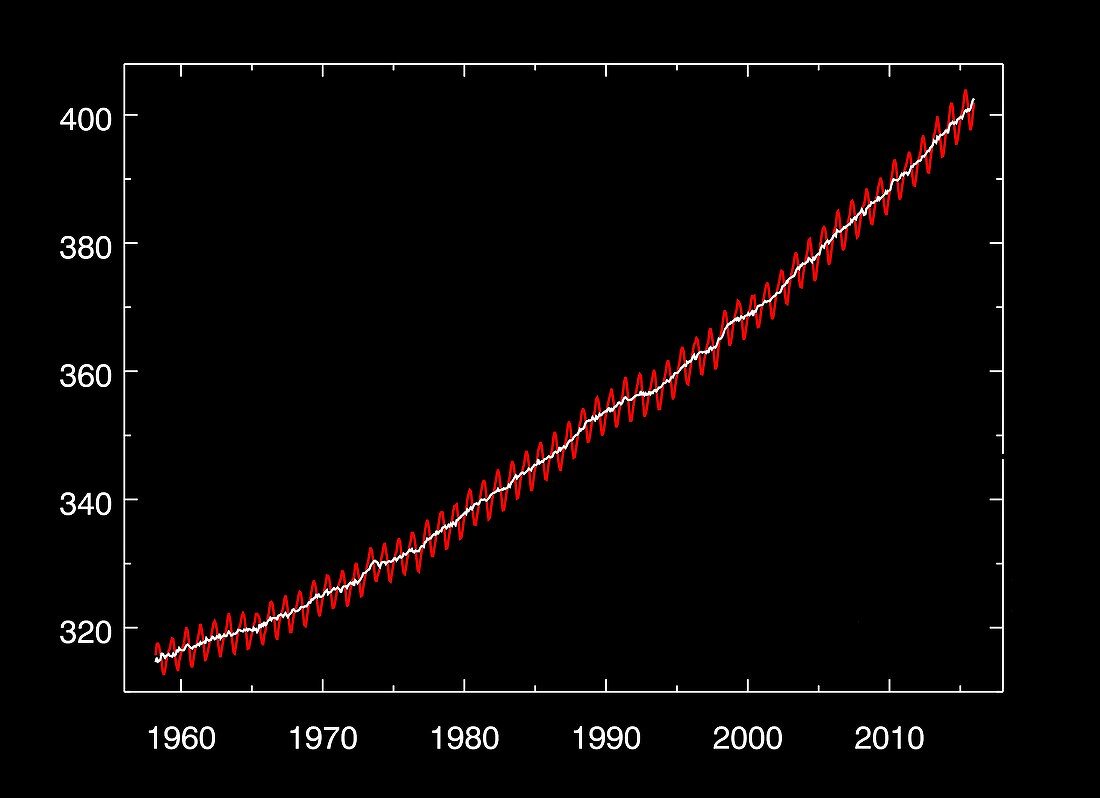
| Mauna Loa CO2 record,1958-2015. Graph showing the results of the carbon dioxide (CO2) measurements (as a monthly mean) from 1958 to the present (January 2016),obtained at the Mauna Loa Observatory,Hawaii. Relatively isolated due to its mid-Pacific location,this is the longest record made of direct measurements of atmospheric CO2. It shows a steady increase in concentrations (measured in parts per million,ppm) from less than 320 ppm to over 400 ppm. Started by C. David Keeling of the Scripps Institution of Oceanography in March 1958,the graph is known as the Keeling Curve. This increase in CO2 is a key cause of global warming | |
| Lizenzart: | Lizenzpflichtig |
| Credit: | Science Photo Library / NOAA |
| Bildgröße: | 3533 px × 2563 px |
| Modell-Rechte: | nicht erforderlich |
| Eigentums-Rechte: | nicht erforderlich |
| Restrictions: |
|
Preise für dieses Bild ab 15 €
Universitäten & Organisationen
(Informationsmaterial Digital, Informationsmaterial Print, Lehrmaterial Digital etc.)
ab 15 €
Redaktionell
(Bücher, Bücher: Sach- und Fachliteratur, Digitale Medien (redaktionell) etc.)
ab 30 €
Werbung
(Anzeigen, Aussenwerbung, Digitale Medien, Fernsehwerbung, Karten, Werbemittel, Zeitschriften etc.)
ab 55 €
Handelsprodukte
(bedruckte Textilie, Kalender, Postkarte, Grußkarte, Verpackung etc.)
ab 75 €
Pauschalpreise
Rechtepakete für die unbeschränkte Bildnutzung in Print oder Online
ab 495 €
Keywords
- 1900er Jahre,
- 20. Jahrhundert,
- 2015,
- 21. Jahrhundert,
- atmosphärisch,
- cgi,
- chemisch,
- Daten,
- Diagramm,
- digital erzeugtes Bild,
- Ergebnis,
- Forschung,
- Gas,
- Geschichte,
- Globale Erwärmung,
- Hawaii,
- historisch,
- Illustration,
- Klimatologie,
- klimatologisch,
- Klimawandel,
- Kohlendioxid,
- Konzentration,
- Kunstwerk,
- Kurve,
- Mauna Loa,
- Niemand,
- Pazifik,
- ppm,
- schwarzer Hintergrund,
- Teile pro Million,
- Treibhausgas,
- Trend,
- Umweltwissenschaften,
- Zeit