Global atmospheric methane
Bildnummer 11727727
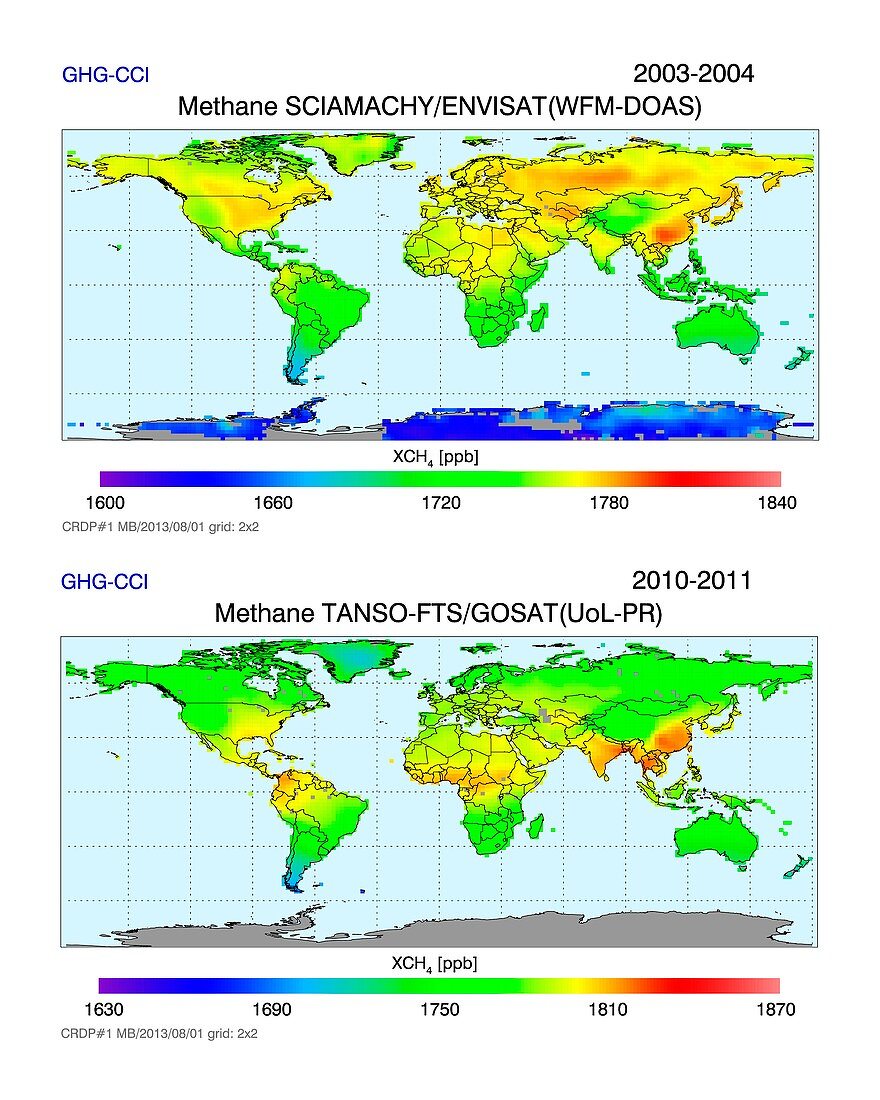
| Maps showing the global distribution of atmospheric methane (CH4) from 2003-2004 (top) and 2010-2011 (bottom). Concentration,in parts per billion (ppb),is colour-coded,from purple (low),through blue and green to yellow and red (high). The scale changes for the two images,as in 2010-2011 average global methane is approximately 30 ppb higher than 2003-2004. High emission areas include wetlands in Siberia and the USA,rice fields in China,and coal and gas mining in the USA. 2003-2004 data from the Sciamachy instrument on ESA's Envisat satellite. 2010-2011 data from the TANSO-FTS (Infrared Fourier Transform Spectrometer) instrument on Japan's GOSAT (Greenhouse Gases Observing Satellite) satellite | |
| Lizenzart: | Lizenzpflichtig |
| Credit: | Science Photo Library / ESA / University Bremen |
| Bildgröße: | 4111 px × 5138 px |
| Modell-Rechte: | nicht erforderlich |
| Eigentums-Rechte: | nicht erforderlich |
| Restrictions: |
|
Preise für dieses Bild ab 15 €
Universitäten & Organisationen
(Informationsmaterial Digital, Informationsmaterial Print, Lehrmaterial Digital etc.)
ab 15 €
Redaktionell
(Bücher, Bücher: Sach- und Fachliteratur, Digitale Medien (redaktionell) etc.)
ab 30 €
Werbung
(Anzeigen, Aussenwerbung, Digitale Medien, Fernsehwerbung, Karten, Werbemittel, Zeitschriften etc.)
ab 55 €
Handelsprodukte
(bedruckte Textilie, Kalender, Postkarte, Grußkarte, Verpackung etc.)
ab 75 €
Pauschalpreise
Rechtepakete für die unbeschränkte Bildnutzung in Print oder Online
ab 495 €
Keywords
- 2000er Jahre,
- 2010,
- 2011,
- 21. Jahrhundert,
- Atmosphäre,
- atmosphärisch,
- CH4,
- chemisch,
- Erdbeobachtung,
- Erde,
- Erdkunde,
- Globale Erwärmung,
- Karte,
- Karten,
- Klimatologie,
- klimatologisch,
- Klimawandel,
- Konzentration,
- Maßstab,
- Methan,
- Niemand,
- Satellit,
- Satellitenbild,
- Treibhausgas,
- Umweltwissenschaften,
- Variation,
- Vergleich,
- Weltall,
- weltweit