Global carbon monoxide levels,April 2008
Bildnummer 11723993
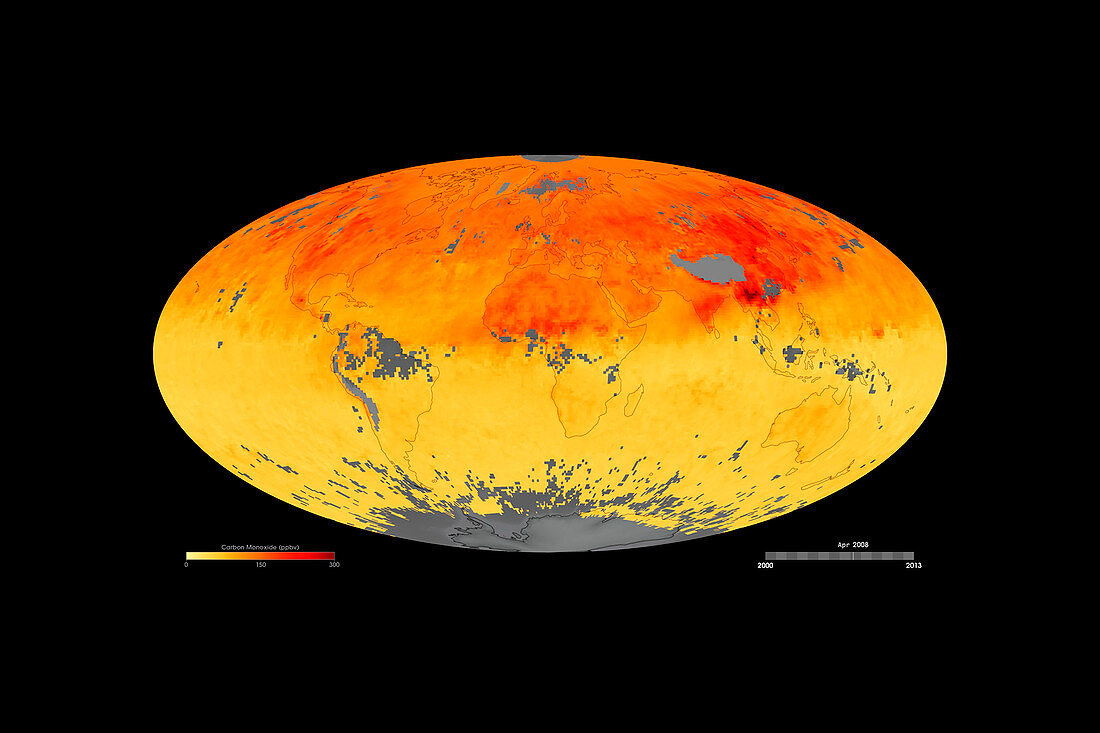
| Global carbon monoxide levels. Satellite-based map showing levels of carbon monoxide gas in the troposphere (the lower atmosphere) for April 2008. Produced by wildfires and human burning of fuels,carbon monoxide contributes to the formation of harmful ground-level ozone. Levels are measured in parts per billion by volume (ppbv),colour-coded from low (yellow) to high (orange and red). Grey areas are where no data was available. The data was obtained by the Measurements of Pollutants in the Troposphere (MOPITT) sensor on NASA's Terra satellite. The levels of carbon monoxide have decreased from 2000 to 2013 (see images C026/4700 to C026/4703) | |
| Lizenzart: | Lizenzpflichtig |
| Credit: | Science Photo Library / NASA / Jesse Allen / NASA Earth Observatory / Goddard Space Flight Center |
| Bildgröße: | 3619 px × 2412 px |
| Modell-Rechte: | nicht erforderlich |
| Eigentums-Rechte: | nicht erforderlich |
| Restrictions: | - |
Preise für dieses Bild ab 15 €
Universitäten & Organisationen
(Informationsmaterial Digital, Informationsmaterial Print, Lehrmaterial Digital etc.)
ab 15 €
Redaktionell
(Bücher, Bücher: Sach- und Fachliteratur, Digitale Medien (redaktionell) etc.)
ab 30 €
Werbung
(Anzeigen, Aussenwerbung, Digitale Medien, Fernsehwerbung, Karten, Werbemittel, Zeitschriften etc.)
ab 55 €
Handelsprodukte
(bedruckte Textilie, Kalender, Postkarte, Grußkarte, Verpackung etc.)
ab 75 €
Pauschalpreise
Rechtepakete für die unbeschränkte Bildnutzung in Print oder Online
ab 495 €
Keywords
- 21. Jahrhundert,
- April,
- Atmosphäre,
- atmosphärisch,
- ausgeschnitten,
- Ausschnitte,
- chemisch,
- Co,
- Daten,
- Ebenen,
- Erde,
- farbcodiert,
- Forschung,
- Gas,
- Geowissenschaften,
- Karte,
- Klima,
- Klimatologie,
- klimatologisch,
- Messung,
- Mopitt,
- NASA,
- Niemand,
- Oval,
- Planet,
- planetarisch,
- Reihenfolge,
- Satellit,
- Schadstoff,
- schwarzer Hintergrund,
- Serie,
- Terra,
- Überwachung,
- Umweltwissenschaften,
- Verschmutzung,
- Weltall,
- weltweit