Global average sea levels,1993-2010
Bildnummer 11713014
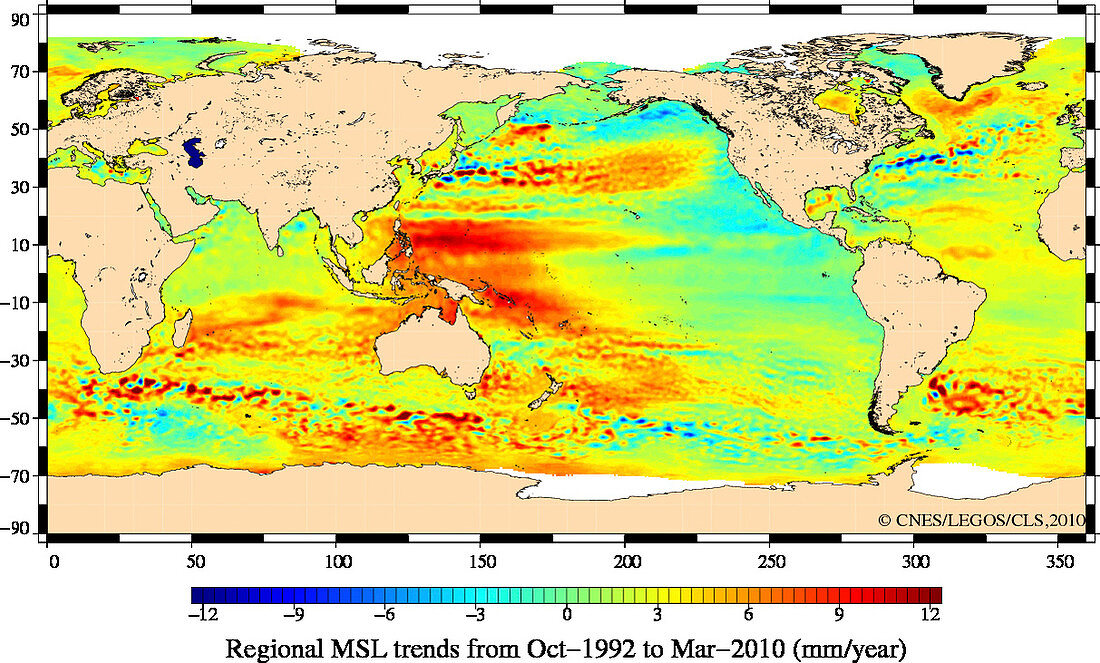
| Global average sea levels,1993-2010. Map showing regional mean sea level (MSL) trends around the world between 1993-2010. Although the global trend indicates a rise in the mean level of the oceans,there are marked regional differences that vary between -10 and +10 mm/year. Image obtained using data from the ESA (European Space Agency) Climate Change Initiative Sea Level Project (SL_cci) Fundamental Climate Data Record (FCDR),then gridded using radar altimeter data from 1993 until 2010 | |
| Lizenzart: | Lizenzpflichtig |
| Credit: | Science Photo Library / LEGOS / CNES / CLS / ESA |
| Bildgröße: | 1214 px × 732 px |
| Modell-Rechte: | nicht erforderlich |
| Eigentums-Rechte: | nicht erforderlich |
| Restrictions: |
|
Preise für dieses Bild ab 15 €
Universitäten & Organisationen
(Informationsmaterial Digital, Informationsmaterial Print, Lehrmaterial Digital etc.)
ab 15 €
Redaktionell
(Bücher, Bücher: Sach- und Fachliteratur, Digitale Medien (redaktionell) etc.)
ab 30 €
Werbung
(Anzeigen, Aussenwerbung, Digitale Medien, Fernsehwerbung, Karten, Werbemittel, Zeitschriften etc.)
ab 55 €
Handelsprodukte
(bedruckte Textilie, Kalender, Postkarte, Grußkarte, Verpackung etc.)
ab 75 €
Pauschalpreise
Rechtepakete für die unbeschränkte Bildnutzung in Print oder Online
ab 495 €
Keywords
- 20. Jahrhundert,
- 2010,
- 21. Jahrhundert,
- abgebildet,
- altimetrisch,
- Daten,
- Ebenen,
- Erdbeobachtung,
- esa,
- Europäische Weltraumbehörde,
- Globale Erwärmung,
- Globus,
- Hydrologie,
- Karte,
- Klimatologie,
- klimatologisch,
- Klimawandel,
- Küste,
- Küsten-,
- Meereskunde,
- Meteorologie,
- meteorologisch,
- mittlerer Meeresspiegel,
- msl,
- Niemand,
- Ozeane,
- Radaraltimetrie,
- Satellitenbild,
- Trend,
- Umwelt,
- Umweltwissenschaften,
- Unterschied,
- Unterschiede,
- Veränderung,
- Wasser,
- weißer Hintergrund,
- Weltall,
- weltweit