Global carbon dioxide transport,2008
Bildnummer 11569546
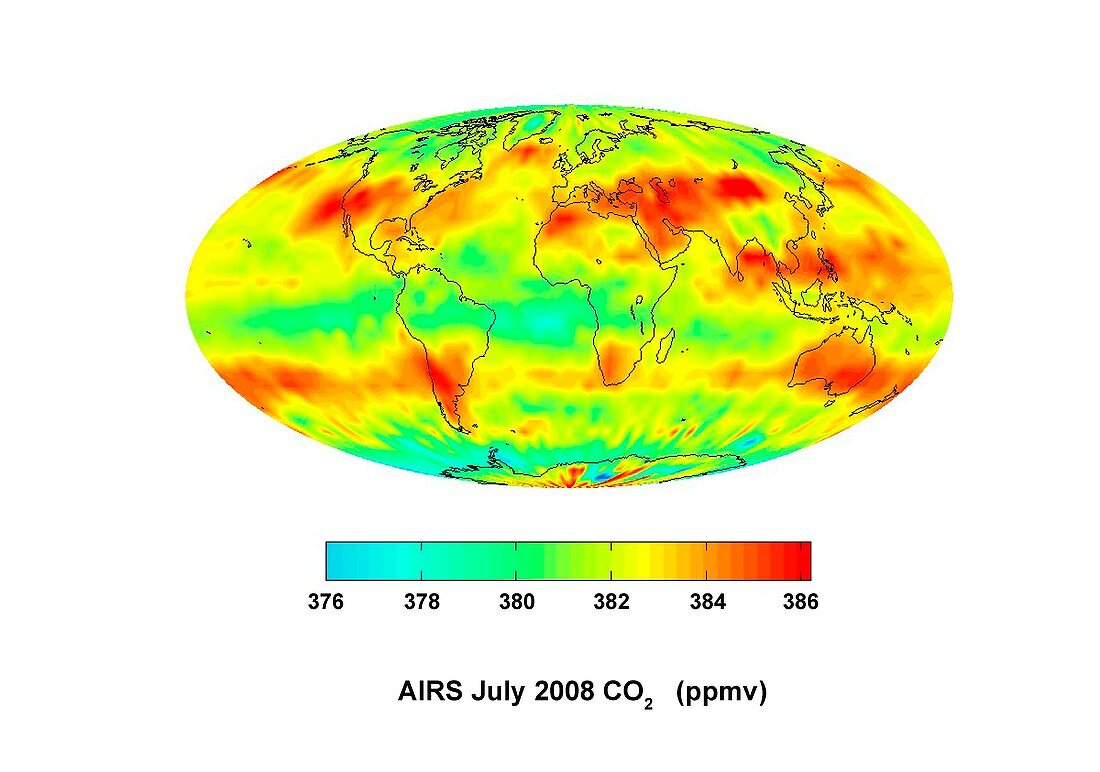
| Global carbon dioxide transport,2008. Map showing the global variation in atmospheric carbon dioxide levels in July 2008. A scale is at bottom,in parts per million by volume (ppmv),ranging from low (blue and green) to high (orange and red). This map shows how the mid-latitude northern and southern jet streams play a role in moving carbon dioxide around the globe. This global data is from the AIRS (Atmospheric Infrared Sounder) instrument on NASA's Aqua satellite | |
| Lizenzart: | Lizenzpflichtig |
| Credit: | Science Photo Library / NASA / JPL |
| Bildgröße: | 4999 px × 3510 px |
| Modell-Rechte: | nicht erforderlich |
| Eigentums-Rechte: | nicht erforderlich |
| Restrictions: | - |
Preise für dieses Bild ab 15 €
Universitäten & Organisationen
(Informationsmaterial Digital, Informationsmaterial Print, Lehrmaterial Digital etc.)
ab 15 €
Redaktionell
(Bücher, Bücher: Sach- und Fachliteratur, Digitale Medien (redaktionell) etc.)
ab 30 €
Werbung
(Anzeigen, Aussenwerbung, Digitale Medien, Fernsehwerbung, Karten, Werbemittel, Zeitschriften etc.)
ab 55 €
Handelsprodukte
(bedruckte Textilie, Kalender, Postkarte, Grußkarte, Verpackung etc.)
ab 75 €
Pauschalpreise
Rechtepakete für die unbeschränkte Bildnutzung in Print oder Online
ab 495 €
Keywords
- 21. Jahrhundert,
- aqua,
- Atmosphäre,
- atmosphärisch,
- Erde,
- Erdkunde,
- Experiment,
- Forschung,
- Geowissenschaften,
- Globale Erwärmung,
- infrarot,
- Juli,
- Karte,
- Klimatologie,
- klimatologisch,
- Klimawandel,
- Kohlendioxid,
- Maßstab,
- Modell-,
- Planet,
- Satellitenbild,
- Schlüssel,
- Treibhausgas,
- Umweltwissenschaften,
- Variation,
- Variationen,
- Weltall,
- weltweit