Global tropospheric methane,2005
Bildnummer 11569545
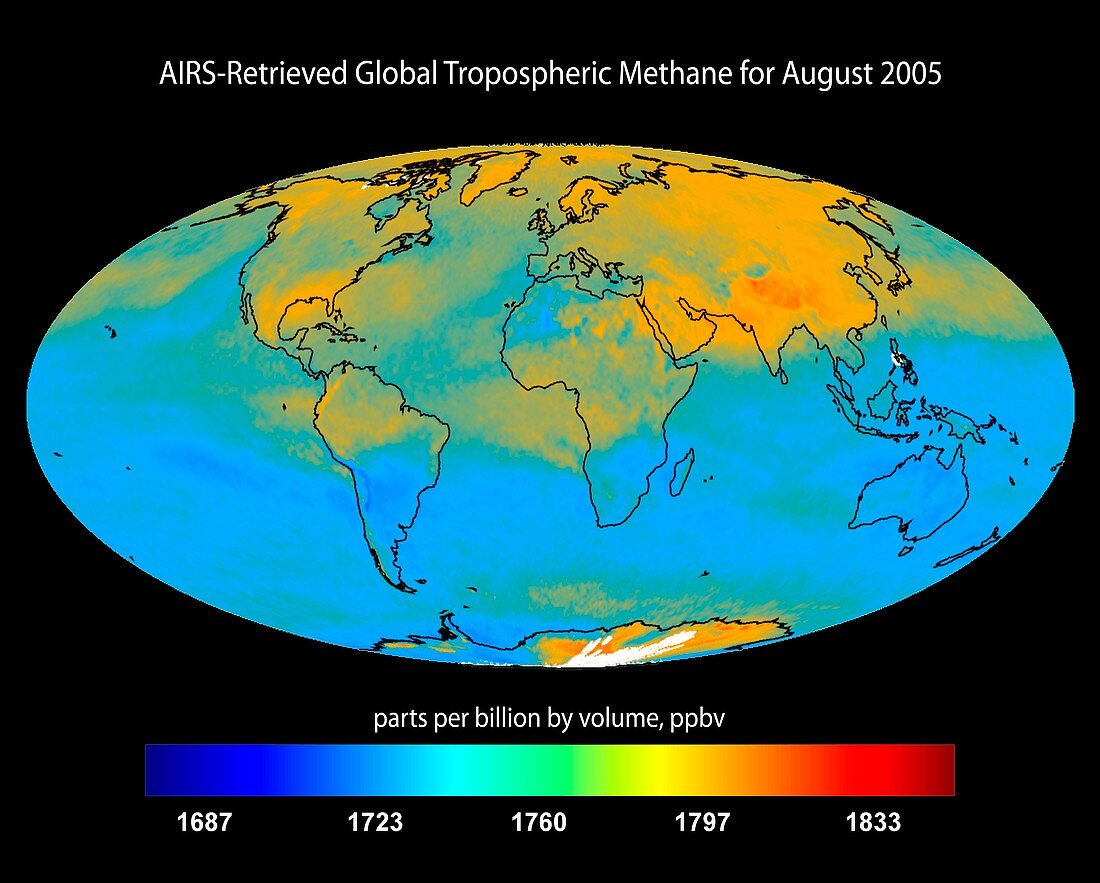
| Global tropospheric methane,2005. Map showing the global variation of the greenhouse gas methane in the troposphere in August 2005. A scale is at bottom in parts per billion by volume (ppbv),ranging from low (blue) to high (orange and red). This and similar maps are used to study the natural and human sources of methane,and its global and seasonal variations. This global data was obtained by the AIRS (Atmospheric Infrared Sounder) instrument on NASA's Aqua satellite | |
| Lizenzart: | Lizenzpflichtig |
| Credit: | Science Photo Library / NASA / JPL |
| Bildgröße: | 4709 px × 3780 px |
| Modell-Rechte: | nicht erforderlich |
| Eigentums-Rechte: | nicht erforderlich |
| Restrictions: | - |
Preise für dieses Bild ab 15 €
Universitäten & Organisationen
(Informationsmaterial Digital, Informationsmaterial Print, Lehrmaterial Digital etc.)
ab 15 €
Redaktionell
(Bücher, Bücher: Sach- und Fachliteratur, Digitale Medien (redaktionell) etc.)
ab 30 €
Werbung
(Anzeigen, Aussenwerbung, Digitale Medien, Fernsehwerbung, Karten, Werbemittel, Zeitschriften etc.)
ab 55 €
Handelsprodukte
(bedruckte Textilie, Kalender, Postkarte, Grußkarte, Verpackung etc.)
ab 75 €
Pauschalpreise
Rechtepakete für die unbeschränkte Bildnutzung in Print oder Online
ab 495 €
Keywords
- 21. Jahrhundert,
- alljährlich,
- aqua,
- Atmosphäre,
- atmosphärisch,
- August,
- CH4,
- Erde,
- Erdkunde,
- Experiment,
- Forschung,
- Geowissenschaften,
- Globale Erwärmung,
- infrarot,
- Karte,
- Klimatologie,
- klimatologisch,
- Klimawandel,
- Maßstab,
- Methan,
- Modell-,
- Planet,
- Satellitenbild,
- Schlüssel,
- Treibhausgas,
- Umweltwissenschaften,
- Variation,
- Variationen,
- Weltall,
- weltweit