Global carbon dioxide variations,2006
Bildnummer 11568901
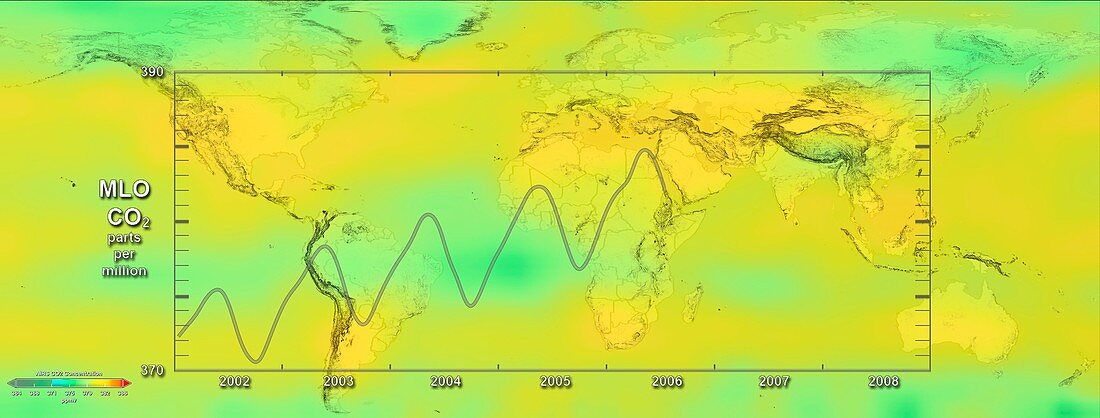
| Global carbon dioxide variations,2006. Map showing the global variation in average atmospheric carbon dioxide levels in the troposphere on 17 July 2006. This is part of a sequence showing the average carbon dioxide levels increasing from 2003 to 2008,changing colour from green to yellow and orange. A scale is at lower left. Superimposed on this is a graph of the annual change at one spot (the Manua Loa Observatory in Hawaii). This shows the cyclic change with the seasons,but also an increase over the six years. The global data is from the AIRS (Atmospheric Infrared Sounder) on NASA's Aqua satellite | |
| Lizenzart: | Lizenzpflichtig |
| Credit: | Science Photo Library / GSFC-SVS / NASA |
| Bildgröße: | 6838 px × 2598 px |
| Modell-Rechte: | nicht erforderlich |
| Eigentums-Rechte: | nicht erforderlich |
| Restrictions: | - |
Preise für dieses Bild ab 15 €
Universitäten & Organisationen
(Informationsmaterial Digital, Informationsmaterial Print, Lehrmaterial Digital etc.)
ab 15 €
Redaktionell
(Bücher, Bücher: Sach- und Fachliteratur, Digitale Medien (redaktionell) etc.)
ab 30 €
Werbung
(Anzeigen, Aussenwerbung, Digitale Medien, Fernsehwerbung, Karten, Werbemittel, Zeitschriften etc.)
ab 55 €
Handelsprodukte
(bedruckte Textilie, Kalender, Postkarte, Grußkarte, Verpackung etc.)
ab 75 €
Pauschalpreise
Rechtepakete für die unbeschränkte Bildnutzung in Print oder Online
ab 495 €
Keywords
- 21. Jahrhundert,
- alljährlich,
- aqua,
- Atmosphäre,
- atmosphärisch,
- Erde,
- Erdkunde,
- Experiment,
- Forschung,
- Geowissenschaften,
- Globale Erwärmung,
- infrarot,
- Juli,
- Karte,
- Klimatologie,
- klimatologisch,
- Klimawandel,
- Kohlendioxid,
- Manua Loa Observatorium,
- Maßstab,
- MLO,
- Modell-,
- Planet,
- Reihenfolge,
- saisonal,
- Satellitenbild,
- Schlüssel,
- Serie,
- Steigend,
- Treibhausgas,
- Umweltwissenschaften,
- Variation,
- Variationen,
- Weltall,
- weltweit