Sea surface temperature,2005 global map
Bildnummer 11568895
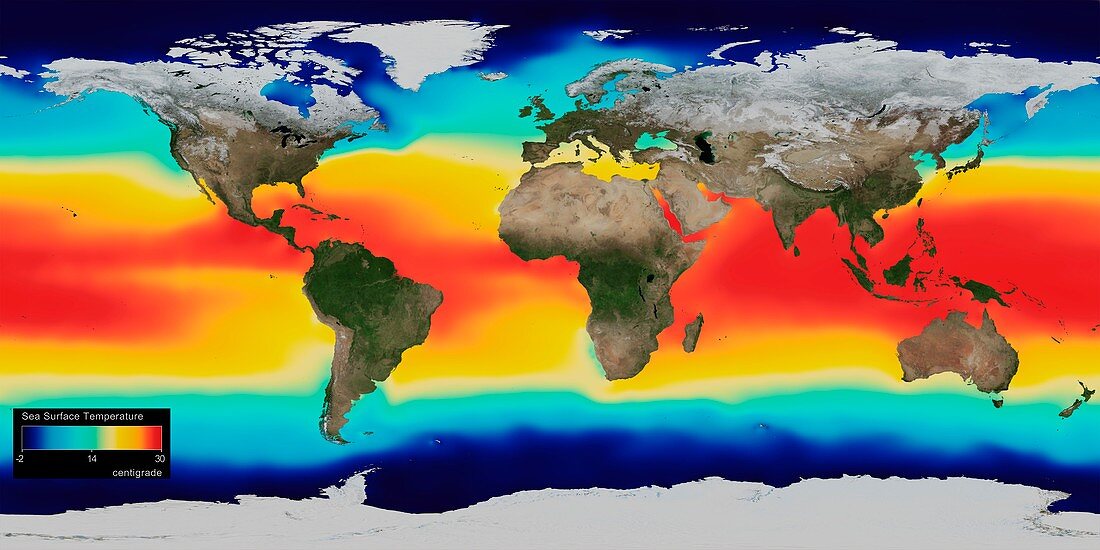
| Sea surface temperature,2005 global map. The world's oceans are heated by sunlight,with variations in the surface temperature caused by varying latitude,the Earth's rotation,and axial tilt. Here,yellow and red colours show temperatures of 20 to 30 degrees Celsius in the equatorial regions. Colder temperatures further north and south are green and blue,from 10 to -2 degrees Celsius. Cooler regions are seen off the western coasts of Africa,South America and North America,where land-sea winds blow warm water away. The data used in this map is from the World Ocean Atlas 2005 | |
| Lizenzart: | Lizenzpflichtig |
| Credit: | Science Photo Library / GSFC-SVS / NASA |
| Bildgröße: | 6142 px × 3071 px |
| Modell-Rechte: | nicht erforderlich |
| Eigentums-Rechte: | nicht erforderlich |
| Restrictions: | - |
Preise für dieses Bild ab 15 €
Universitäten & Organisationen
(Informationsmaterial Digital, Informationsmaterial Print, Lehrmaterial Digital etc.)
ab 15 €
Redaktionell
(Bücher, Bücher: Sach- und Fachliteratur, Digitale Medien (redaktionell) etc.)
ab 30 €
Werbung
(Anzeigen, Aussenwerbung, Digitale Medien, Fernsehwerbung, Karten, Werbemittel, Zeitschriften etc.)
ab 55 €
Handelsprodukte
(bedruckte Textilie, Kalender, Postkarte, Grußkarte, Verpackung etc.)
ab 75 €
Pauschalpreise
Rechtepakete für die unbeschränkte Bildnutzung in Print oder Online
ab 495 €
Keywords
- 21. Jahrhundert,
- Amerikanisch,
- cool,
- Durschnitt,
- Eigenschaften,
- Eigentum,
- einfrieren,
- Erde,
- Erdkunde,
- Erhitzt,
- Experiment,
- Forschung,
- Gefroren,
- geografisch,
- Geographie,
- Geowissenschaften,
- Globale Erwärmung,
- heiß,
- Hitze,
- Kalt,
- Karte,
- Klimatologie,
- klimatologisch,
- Klimawandel,
- Maßstab,
- Meer,
- Meereskunde,
- Messung,
- Modell-,
- Oberfläche,
- Ozean,
- Planet,
- planetarisch,
- Schlüssel,
- sst,
- Temperatur,
- Umweltwissenschaften,
- uns,
- Warm,
- Wasser,
- Welt,
- weltweit