Monthly global precipitation,May
Bildnummer 11566418
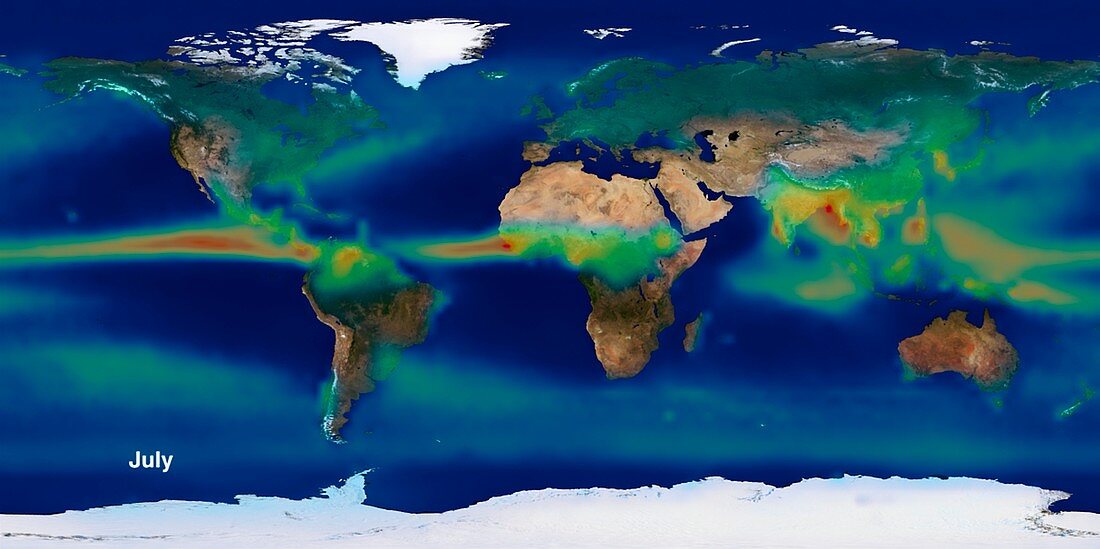
| Average monthly global precipitation. Computer model showing the monthly mean global precipitation in July between 1979 and 2006. The colour scale runs from black for 0 millimetres of precipitation per day,through blue,green and yellow to red for areas that received more than 15 millimetres of precipitation a day. The data is a combination of satellite estimates and rain gauge readings. It will be used to verify climate models and to study the hydrological cycle | |
| Lizenzart: | Lizenzpflichtig |
| Credit: | Science Photo Library / NASA |
| Bildgröße: | 5921 px × 2953 px |
| Modell-Rechte: | nicht erforderlich |
| Eigentums-Rechte: | nicht erforderlich |
| Restrictions: | - |
Preise für dieses Bild ab 15 €
Universitäten & Organisationen
(Informationsmaterial Digital, Informationsmaterial Print, Lehrmaterial Digital etc.)
ab 15 €
Redaktionell
(Bücher, Bücher: Sach- und Fachliteratur, Digitale Medien (redaktionell) etc.)
ab 30 €
Werbung
(Anzeigen, Aussenwerbung, Digitale Medien, Fernsehwerbung, Karten, Werbemittel, Zeitschriften etc.)
ab 55 €
Handelsprodukte
(bedruckte Textilie, Kalender, Postkarte, Grußkarte, Verpackung etc.)
ab 75 €
Pauschalpreise
Rechtepakete für die unbeschränkte Bildnutzung in Print oder Online
ab 495 €
Keywords
- 20. Jahrhundert,
- 21. Jahrhundert,
- Atmosphäre,
- atmosphärischer Wasserdampf,
- Durschnitt,
- Erde,
- Erdkunde,
- geografisch,
- Geographie,
- Hydrologie,
- Illustration,
- Juli,
- Karte,
- Klimatologie,
- klimatologisch,
- Kontinent,
- Kunstwerk,
- Meteorologie,
- meteorologisch,
- Modell-,
- Ozean,
- Präzipitation,
- Regen,
- Sommer,
- Umweltwissenschaften,
- weltweit,
- Wetter,
- Wissenschaften