Genetic influences on brain structure, illustration
Bildnummer 13951563
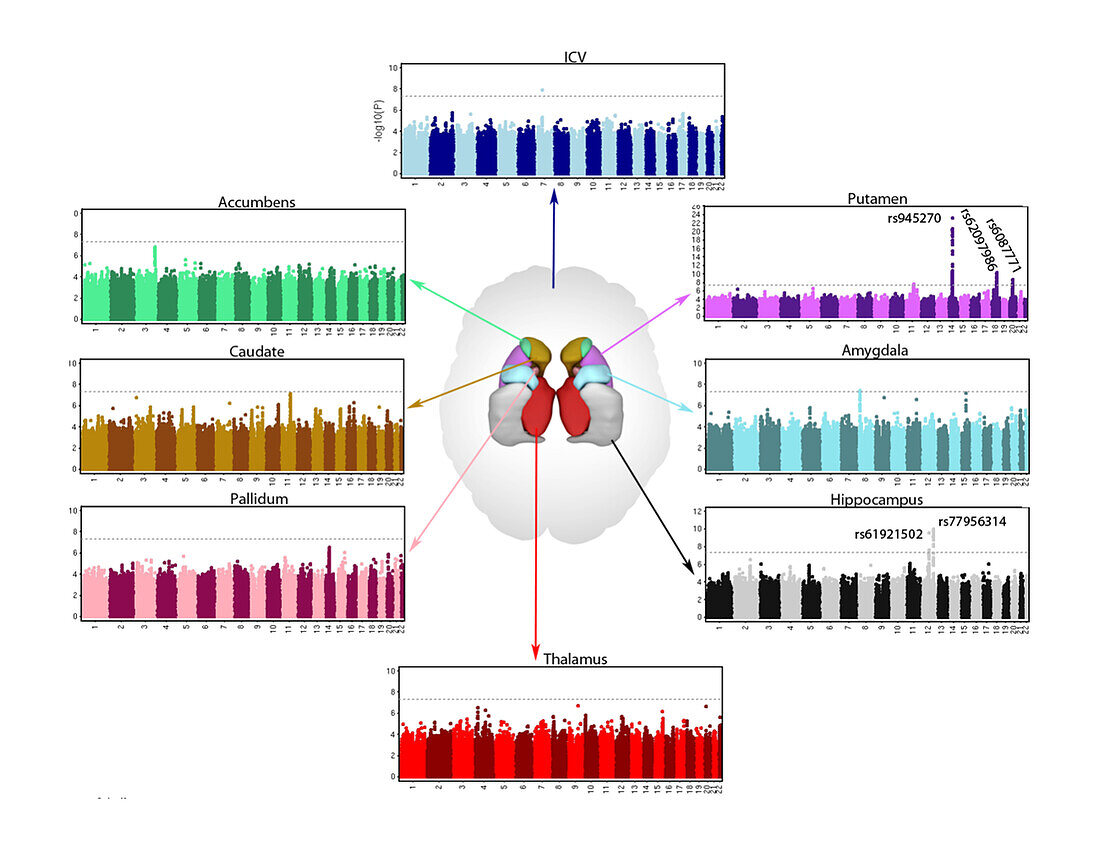
| Charts showing genetic influences on brain structure. The charts are colour-coded to their respective brain structures shown at centre. The charts show the positions of genes (x-axis) and the evidence for association (y-axis) for each common genetic variant that influences brain volume. | |
| Lizenzart: | Lizenzpflichtig |
| Credit: | Science Photo Library / MARK AND MARY STEVENS NEUROIMAGING AND INFORMATICS INSTITUTE |
| Bildgröße: | 4770 px × 3669 px |
| Modell-Rechte: | nicht erforderlich |
| Eigentums-Rechte: | nicht erforderlich |
| Restrictions: | - |
Preise für dieses Bild ab 15 €
Universitäten & Organisationen
(Informationsmaterial Digital, Informationsmaterial Print, Lehrmaterial Digital etc.)
ab 15 €
Redaktionell
(Bücher, Bücher: Sach- und Fachliteratur, Digitale Medien (redaktionell) etc.)
ab 30 €
Werbung
(Anzeigen, Aussenwerbung, Digitale Medien, Fernsehwerbung, Karten, Werbemittel, Zeitschriften etc.)
ab 55 €
Handelsprodukte
(bedruckte Textilie, Kalender, Postkarte, Grußkarte, Verpackung etc.)
ab 75 €
Pauschalpreise
Rechtepakete für die unbeschränkte Bildnutzung in Print oder Online
ab 495 €