Power and frequency of earthquakes, infographic graph
Bildnummer 13743984
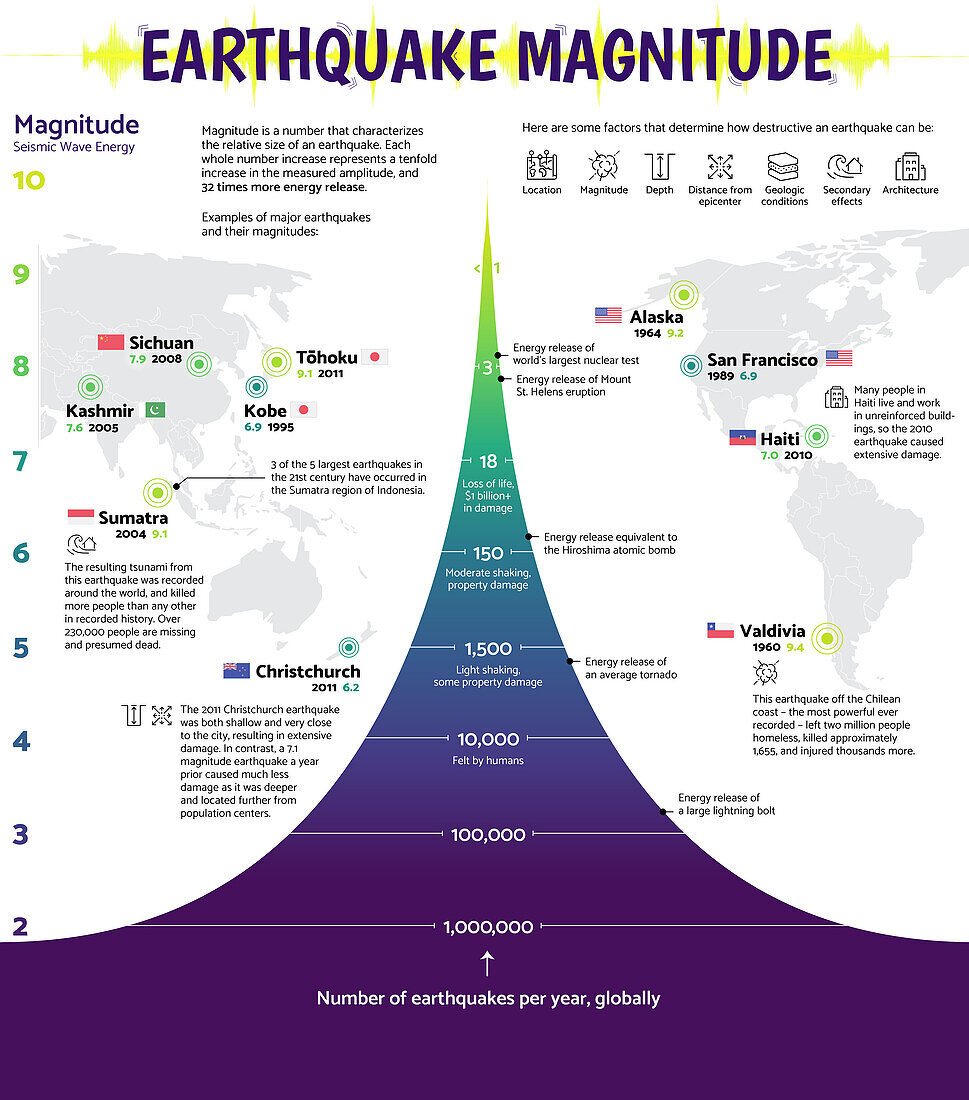
| Infographic graph depicting the power and frequency of earthquakes. The horizontal width indicates the volume of earthquakes and the vertical height represents the magnitude. An earthquake's magnitude is measured from 1 to 10 (least powerful to most powerful) according to the Richter Scale. Over a million low powered earthquakes (rated 2 or below) occur each year. More powerful earthquakes are less common with an average of 18 at magnitude 7 and 3 at magnitude 8. Such earthquakes lead to destruction of buildings and loss of life. This image also highlights a few of the worst earthquakes in history. Data from the US Geological Survey. | |
| Lizenzart: | Lizenzfrei |
| Credit: | Science Photo Library / VISUAL CAPITALIST |
| Modell-Rechte: | nicht erforderlich |
| Eigentums-Rechte: | nicht erforderlich |
| Restrictions: | - |
Preise für dieses Bild ab 29 €
Für digitale Nutzung (72 dpi)
ab 29 €
Für Druckauflösung (300 dpi)
ab 300 €