History of pandemics, illustration
Bildnummer 13743960
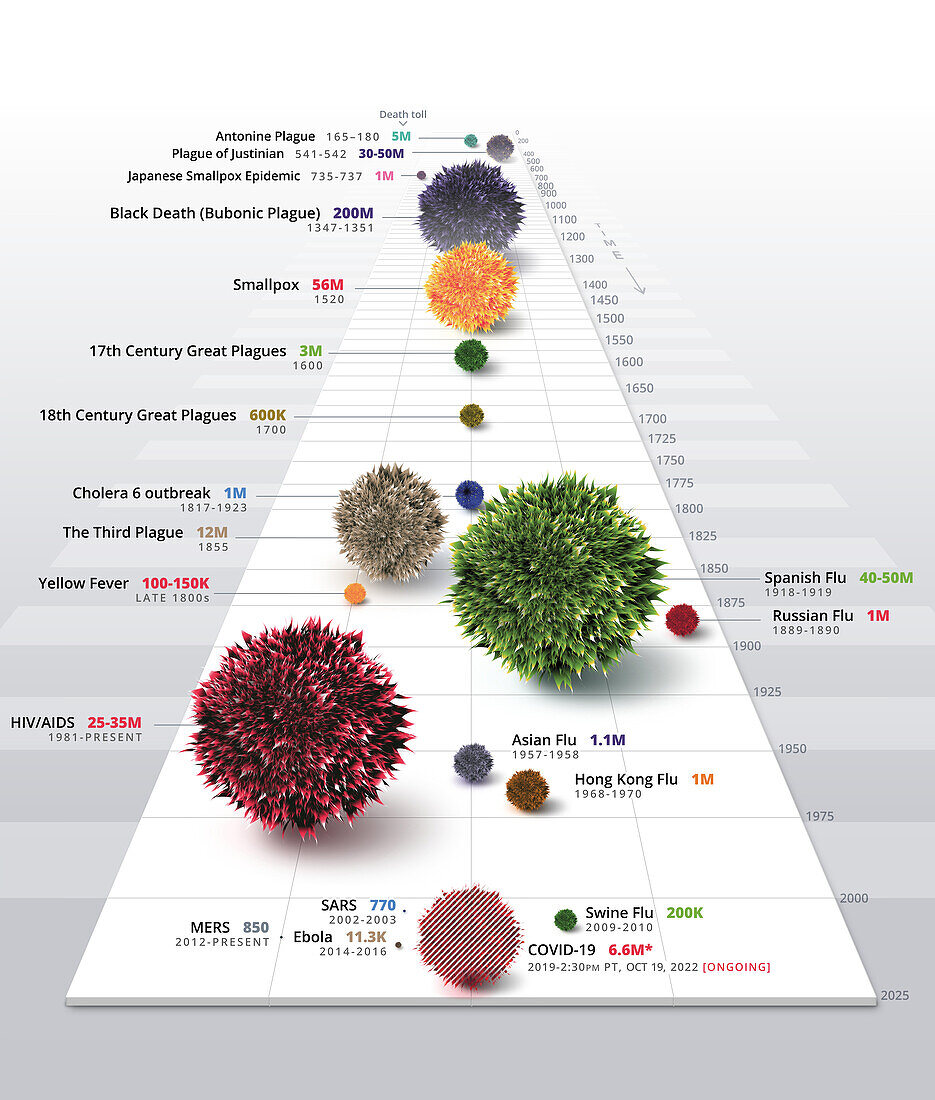
| Infographic illustration depicting a timeline of major historical pandemics. Death toll is depicted by relative size of the spiked spheres. The timeline begins with the Antonine plague (165-180 AD) which was estimated to have killed 5-10 million people and was thought to have been measles or smallpox spread by Roman soldiers returning from the East. The highest pandemic death toll in history is the Black Death (1347-1351), which killed 200 million people. As of October 2022, COVID-19 is estimated to have killed 6.6 million people, making it the 7th worst pandemic in history. | |
| Lizenzart: | Lizenzfrei |
| Credit: | Science Photo Library / VISUAL CAPITALIST |
| Modell-Rechte: | nicht erforderlich |
| Eigentums-Rechte: | nicht erforderlich |
| Restrictions: | - |
Preise für dieses Bild ab 29 €
Für digitale Nutzung (72 dpi)
ab 29 €
Für Druckauflösung (300 dpi)
ab 300 €