ECG U wave and bimodal T wave, illustration
Bildnummer 13685640
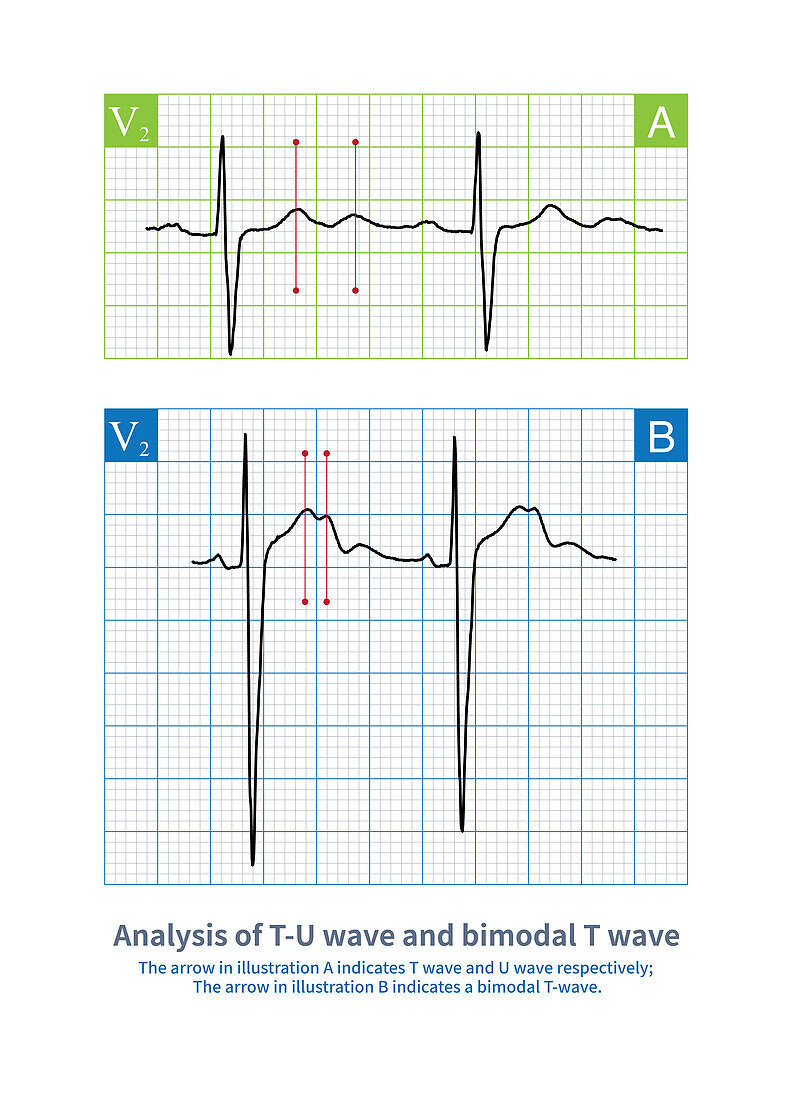
| ECG (electrocardiogram) U wave and bimodal T wave, illustration. If the T-wave notch interval is greater than 150 milliseconds, the fusion of the T-wave and U-wave is preferred. When it is less than 150 milliseconds, it tends to be interpreted as a bimodal T wave. | |
| Lizenzart: | Lizenzpflichtig |
| Credit: | Science Photo Library / CHONGQING TUMI TECHNOLOGY LTD |
| Bildgröße: | 3126 px × 4333 px |
| Modell-Rechte: | nicht erforderlich |
| Eigentums-Rechte: | nicht erforderlich |
| Restrictions: | - |
Preise für dieses Bild ab 15 €
Universitäten & Organisationen
(Informationsmaterial Digital, Informationsmaterial Print, Lehrmaterial Digital etc.)
ab 15 €
Redaktionell
(Bücher, Bücher: Sach- und Fachliteratur, Digitale Medien (redaktionell) etc.)
ab 30 €
Werbung
(Anzeigen, Aussenwerbung, Digitale Medien, Fernsehwerbung, Karten, Werbemittel, Zeitschriften etc.)
ab 55 €
Handelsprodukte
(bedruckte Textilie, Kalender, Postkarte, Grußkarte, Verpackung etc.)
ab 75 €
Pauschalpreise
Rechtepakete für die unbeschränkte Bildnutzung in Print oder Online
ab 495 €