Normal ECG wave in lead V4, illustration
Bildnummer 13453444
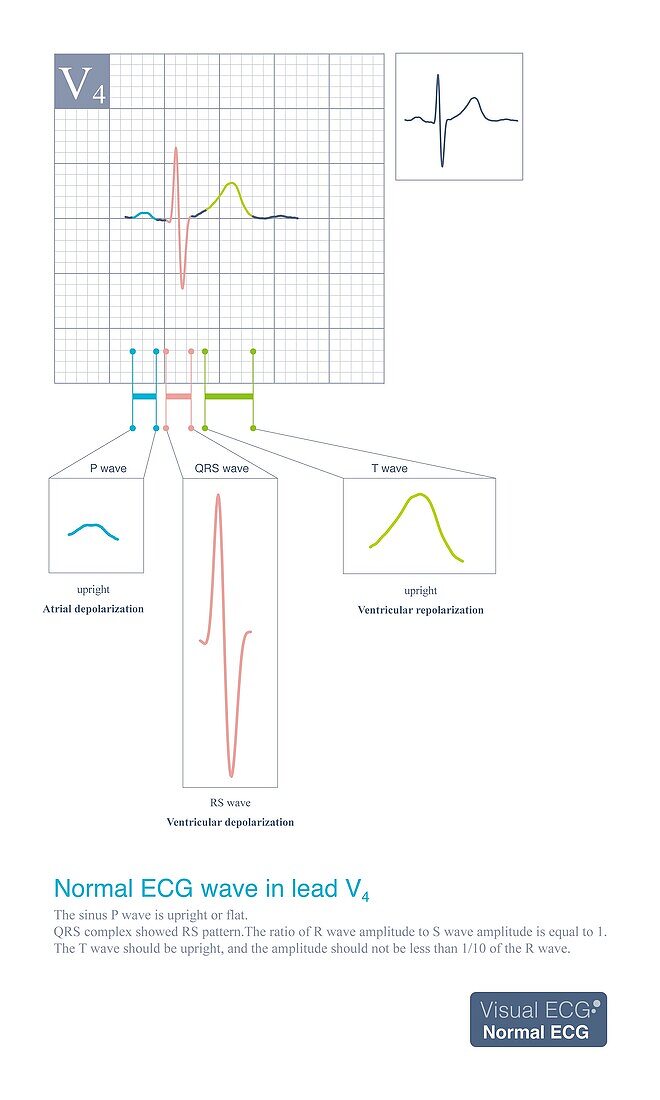
| Electrocardiogram (ECG) illustration showing a normal ECG wave in lead V4. Under normal circumstances, the sinus P wave of lead V4 is upright, the QRS wave is QRS pattern, and the T wave is upright.V3 and V4 chest leads belong to the transition leads. Under normal conditions, the amplitudes of R wave and S wave are equal, which can be seen in these two leads. | |
| Lizenzart: | Lizenzpflichtig |
| Credit: | Science Photo Library / CHONGQING TUMI TECHNOLOGY LTD |
| Bildgröße: | 2800 px × 4667 px |
| Modell-Rechte: | nicht erforderlich |
| Eigentums-Rechte: | nicht erforderlich |
| Restrictions: | - |
Preise für dieses Bild ab 15 €
Universitäten & Organisationen
(Informationsmaterial Digital, Informationsmaterial Print, Lehrmaterial Digital etc.)
ab 15 €
Redaktionell
(Bücher, Bücher: Sach- und Fachliteratur, Digitale Medien (redaktionell) etc.)
ab 30 €
Werbung
(Anzeigen, Aussenwerbung, Digitale Medien, Fernsehwerbung, Karten, Werbemittel, Zeitschriften etc.)
ab 55 €
Handelsprodukte
(bedruckte Textilie, Kalender, Postkarte, Grußkarte, Verpackung etc.)
ab 75 €
Pauschalpreise
Rechtepakete für die unbeschränkte Bildnutzung in Print oder Online
ab 495 €