Average northeast USA nitrogen dioxide levels 2015-19
Bildnummer 13218624
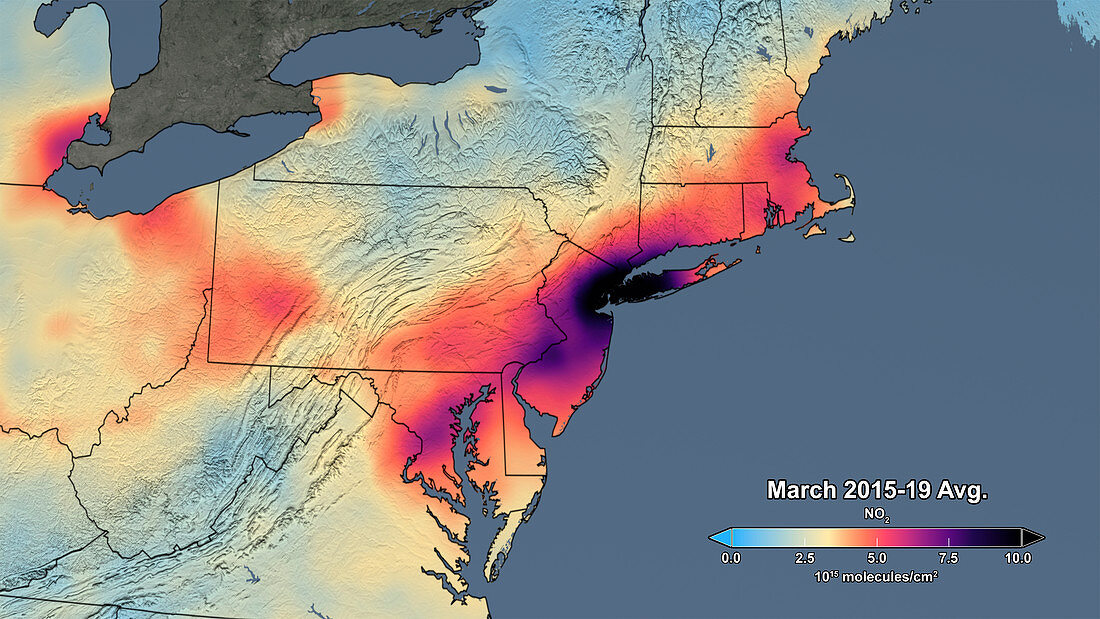
| Satellite data map of the average nitrogen dioxide (NO2) levels in the northeastern USA for March between 2015-19. There are high concentrations (black) around New York City. Nitrogen dioxide is a pollutant gas produced during industrial fossil fuel combustion and by road traffic. Data obtained by the Ozone Monitoring Instrument (OMI) on NASA's Aura satellite. | |
| Lizenzart: | Lizenzpflichtig |
| Credit: | Science Photo Library / NASA / GSFC / NASA's Scientific Visualization Studio |
| Bildgröße: | 5760 px × 3240 px |
| Modell-Rechte: | nicht erforderlich |
| Eigentums-Rechte: | nicht erforderlich |
| Restrictions: | - |
Preise für dieses Bild ab 15 €
Universitäten & Organisationen
(Informationsmaterial Digital, Informationsmaterial Print, Lehrmaterial Digital etc.)
ab 15 €
Redaktionell
(Bücher, Bücher: Sach- und Fachliteratur, Digitale Medien (redaktionell) etc.)
ab 30 €
Werbung
(Anzeigen, Aussenwerbung, Digitale Medien, Fernsehwerbung, Karten, Werbemittel, Zeitschriften etc.)
ab 55 €
Handelsprodukte
(bedruckte Textilie, Kalender, Postkarte, Grußkarte, Verpackung etc.)
ab 75 €
Pauschalpreise
Rechtepakete für die unbeschränkte Bildnutzung in Print oder Online
ab 495 €
Keywords
- 2000er Jahre,
- 2015,
- 2019,
- 21. Jahrhundert,
- Amerikanisch,
- Atmosphäre,
- atmosphärisch,
- Aura,
- Durschnitt,
- Erdbeobachtung,
- Erde,
- Erdkunde,
- farbig,
- Gas,
- gefärbt,
- Karte,
- März,
- New York City,
- Niemand,
- NO2,
- Satellit,
- Schadstoff,
- Schlüssel,
- Umwelt,
- Umweltwissenschaften,
- USA,
- Vereinigte Staaten,
- Verschmutzung,
- Weltall