Orgasm Climax, fMRI
Bildnummer 12647852
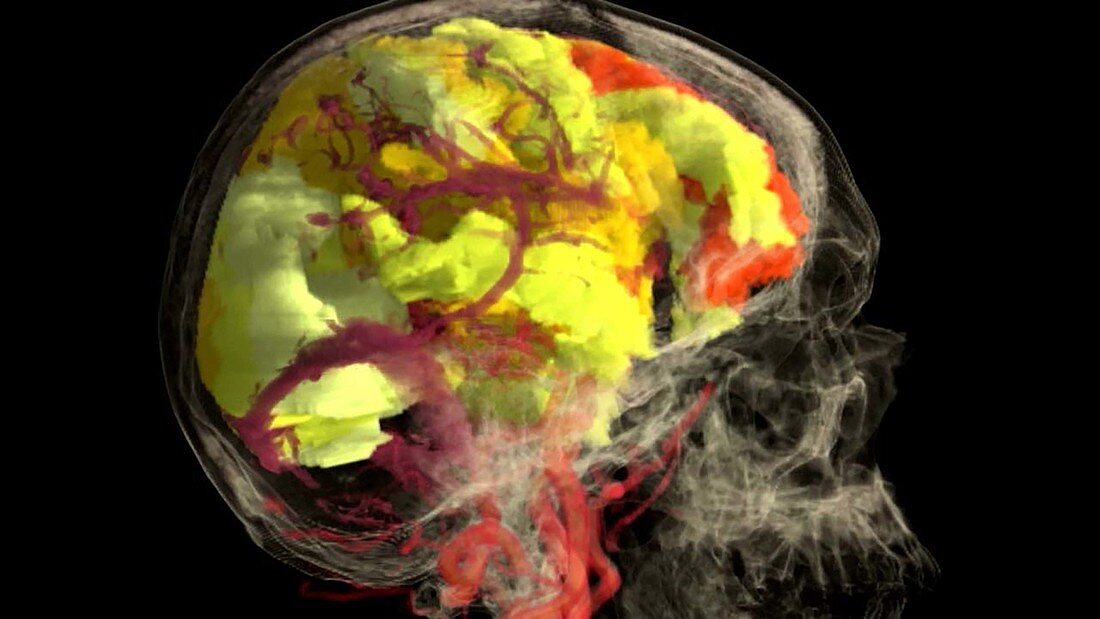
| Medical visualization taken from human scanned data showing brain activity during an orgasm climax. The data was collected using functional magnetic resonance imaging (fMRI). The brain data exhibits a female participant experiencing an orgasm. The corresponding relationships seen within the different regions of the brain are based on utilization of oxygen levels in the blood. Oxygen utilization levels are displayed on a spectrum from dark red (lowest activity) to yellow/white (highest). As can be observed, an orgasm leads to almost the entire brain illuminating yellow, indicating that most brain systems become active at orgasm. The vessels of the brain as well as the skull are also viewable. | |
| Lizenzart: | Lizenzpflichtig |
| Credit: | Science Photo Library / Science Source / TheVisualMD |
| Bildgröße: | 3556 px × 2000 px |
| Modell-Rechte: | nicht erforderlich |
| Eigentums-Rechte: | nicht erforderlich |
| Restrictions: | - |
Preise für dieses Bild ab 15 €
Universitäten & Organisationen
(Informationsmaterial Digital, Informationsmaterial Print, Lehrmaterial Digital etc.)
ab 15 €
Redaktionell
(Bücher, Bücher: Sach- und Fachliteratur, Digitale Medien (redaktionell) etc.)
ab 30 €
Werbung
(Anzeigen, Aussenwerbung, Digitale Medien, Fernsehwerbung, Karten, Werbemittel, Zeitschriften etc.)
ab 55 €
Handelsprodukte
(bedruckte Textilie, Kalender, Postkarte, Grußkarte, Verpackung etc.)
ab 75 €
Pauschalpreise
Rechtepakete für die unbeschränkte Bildnutzung in Print oder Online
ab 495 €
Keywords
- 3 dimensional,
- 3-d,
- 3-dimensional,
- 3D,
- 3D-Visualisierung,
- Anatomie,
- anatomisch,
- Arterie,
- arteriell,
- Arterien,
- Bildgebung,
- biomedizinisch,
- Blutgefäß,
- Blutversorgung,
- Dreidimensional,
- FMRI,
- Frau,
- Frauen,
- Gefäß,
- Gehirn,
- Gehirnaktivität,
- gesund,
- Gesundheitsvorsorge,
- Gesundheitswesen,
- Grafik,
- Großhirn,
- Medizin,
- medizinisch,
- Mensch,
- menschlicher Körper,
- MRI,
- Neurowissenschaften,
- normal,
- Organ,
- Physiologie,
- physiologisch,
- rechte Seite,
- Schädel,
- Seitenansicht,
- seitlich,
- Vene,
- Weiblich,
- zentrales Nervensystem