Ozone hole changes 1979 to 2011, satellite images
Bildnummer 12504590
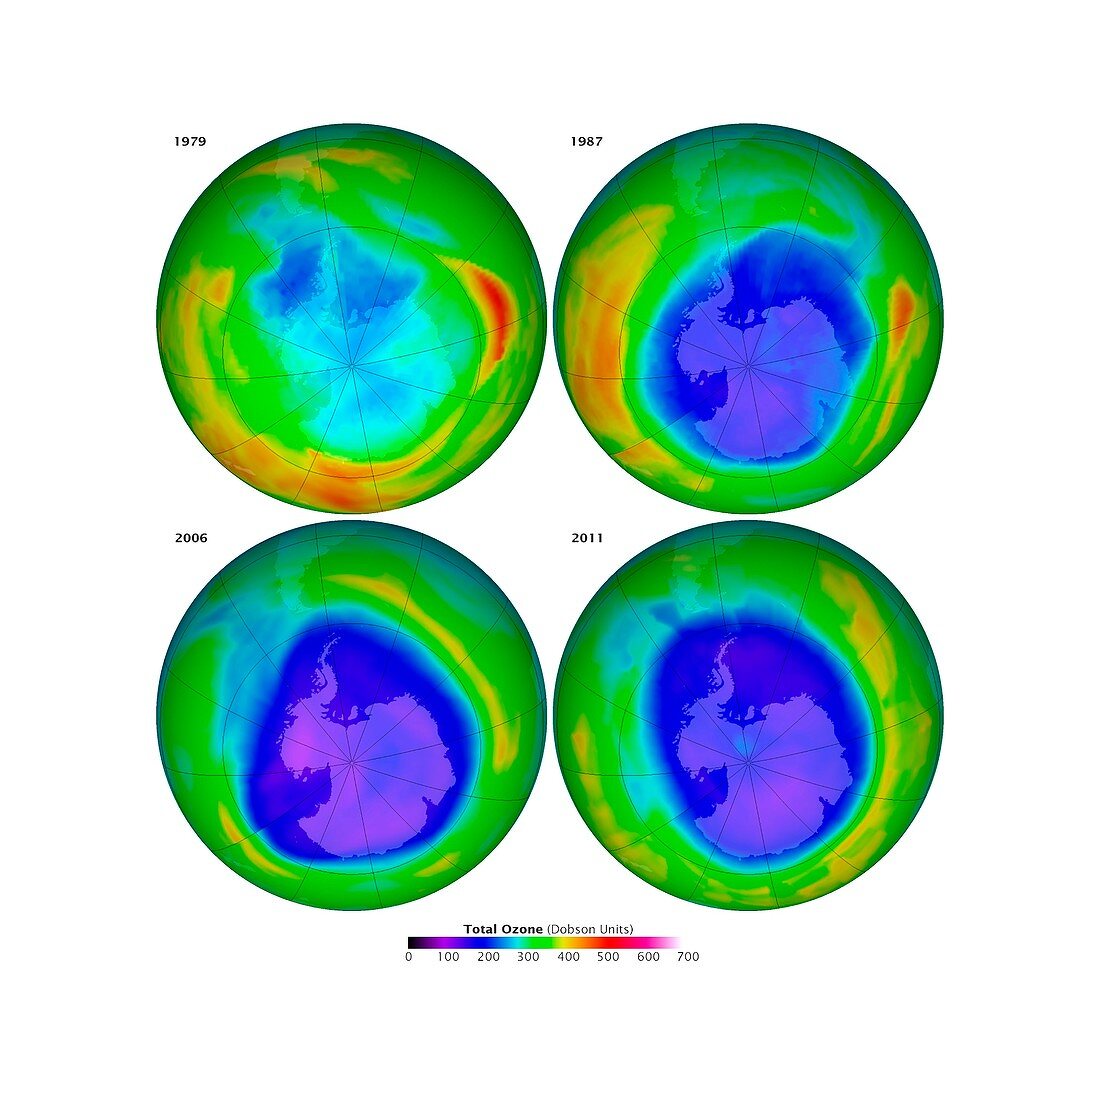
| Ozone hole changes 1979 to 2011, satellite images. The images are from 1979 (upper left), 1987 (upper right), 2006 (lower left) and 2011 (lower right). They show the distribution of ozone in the atmosphere above Antarctica and the South Pole on 16 September of each year, with a colour-coded key at lower centre. Blue and purple show low levels of ozone. 2006 was the worst year for ozone depletion, with the hole nearly 30 million square kilometres in area. Thanks to the Montreal Protocol of 1987, banning the chemicals causing the depletion, the ozone hole has stabilised in recent years and may be slowly recovering. The first two maps use data from the Total Ozone Mapping Spectrometer (TOMS) on the Nimbus-7 satellite. The final two use data from the Ozone Monitoring Instrument (OMI) on the Aura satellite. This set of images was published in 2012. | |
| Lizenzart: | Lizenzpflichtig |
| Credit: | Science Photo Library / Ozone Hole Watch / NASA Earth Observatory |
| Bildgröße: | 2965 px × 2965 px |
| Modell-Rechte: | nicht erforderlich |
| Eigentums-Rechte: | nicht erforderlich |
| Restrictions: | - |
Preise für dieses Bild ab 15 €
Universitäten & Organisationen
(Informationsmaterial Digital, Informationsmaterial Print, Lehrmaterial Digital etc.)
ab 15 €
Redaktionell
(Bücher, Bücher: Sach- und Fachliteratur, Digitale Medien (redaktionell) etc.)
ab 30 €
Werbung
(Anzeigen, Aussenwerbung, Digitale Medien, Fernsehwerbung, Karten, Werbemittel, Zeitschriften etc.)
ab 55 €
Handelsprodukte
(bedruckte Textilie, Kalender, Postkarte, Grußkarte, Verpackung etc.)
ab 75 €
Pauschalpreise
Rechtepakete für die unbeschränkte Bildnutzung in Print oder Online
ab 495 €
Keywords
- 1900er Jahre,
- 20. Jahrhundert,
- 2011,
- 21. Jahrhundert,
- Antarktis,
- atmosphärisch,
- Aura,
- ausgeschnitten,
- Ausschnitte,
- chemisch,
- Erdbeobachtung,
- Erde,
- farbcodiert,
- Montreal-Protokoll,
- Niemand,
- polar,
- Quartett,
- Satellit,
- Satellitenbild,
- Süd-,
- südlichen Hemisphäre,
- Umweltwissenschaften,
- vier,
- weißer Hintergrund,
- Weltall