Global nitrogen dioxide levels for 2014, satellite map
Bildnummer 12257720
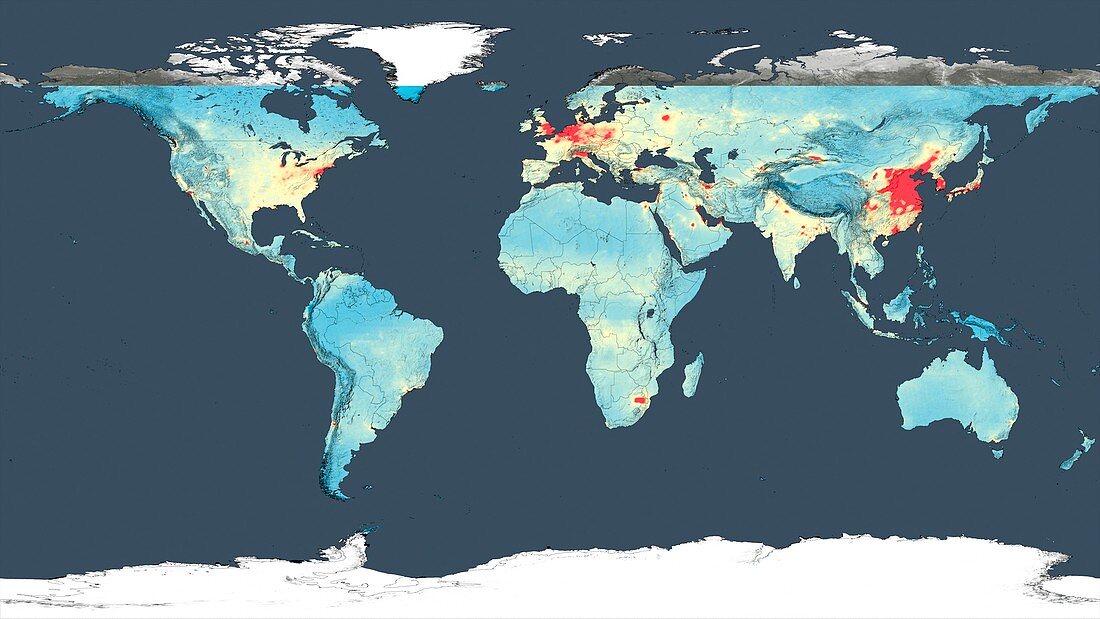
| Global nitrogen dioxide levels for 2014. Satellite map of the global levels in 2014 of the pollutant gas nitrogen dioxide (NO2), produced by cars, power stations and industrial sites. Chemical reactions involving NO2 can produce the respiratory pollutant ozone, contributing to urban smog. This map shows the absolute concentrations of tropospheric NO2, with blue and green colours for lower concentrations, and orange and red for higher concentrations. The data is from the Ozone Monitoring Instrument aboard NASA's Aura satellite. | |
| Lizenzart: | Lizenzpflichtig |
| Credit: | Science Photo Library / NASA's Goddard Space Flight Center |
| Bildgröße: | 4323 px × 2432 px |
| Modell-Rechte: | nicht erforderlich |
| Eigentums-Rechte: | nicht erforderlich |
| Restrictions: | - |
Preise für dieses Bild ab 15 €
Universitäten & Organisationen
(Informationsmaterial Digital, Informationsmaterial Print, Lehrmaterial Digital etc.)
ab 15 €
Redaktionell
(Bücher, Bücher: Sach- und Fachliteratur, Digitale Medien (redaktionell) etc.)
ab 30 €
Werbung
(Anzeigen, Aussenwerbung, Digitale Medien, Fernsehwerbung, Karten, Werbemittel, Zeitschriften etc.)
ab 55 €
Handelsprodukte
(bedruckte Textilie, Kalender, Postkarte, Grußkarte, Verpackung etc.)
ab 75 €
Pauschalpreise
Rechtepakete für die unbeschränkte Bildnutzung in Print oder Online
ab 495 €