Sleep research: polysomnogram trace
Bildnummer 12069709
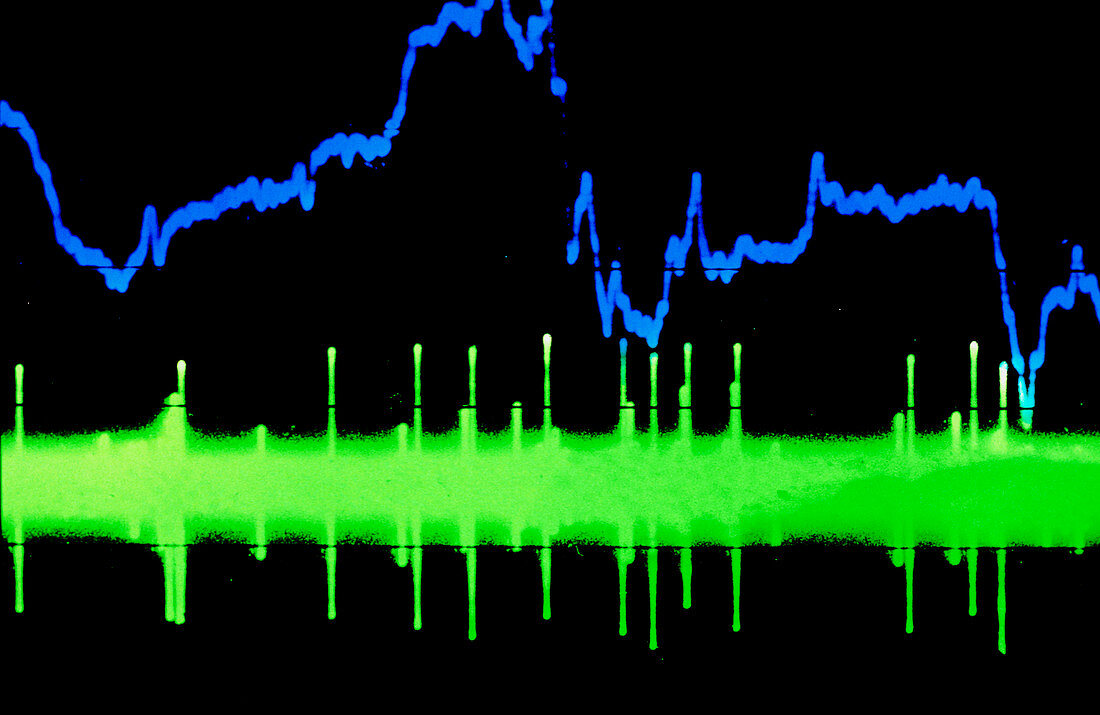
| Sleep research: coloured screen wave output from a polysomnigram of a sleeping subject. The top blue line represents an electroencephalogram (EEG) wave and the green trace at bottom corresponds to rapid eye movements. The changes observed using an EEG in normal sleep are often more dramatic than those relating to disease conditions | |
| Lizenzart: | Lizenzpflichtig |
| Credit: | Science Photo Library / Hobson, Allan |
| Bildgröße: | 3818 px × 2480 px |
| Modell-Rechte: | nicht erforderlich |
| Eigentums-Rechte: | nicht erforderlich |
| Restrictions: |
|
Preise für dieses Bild ab 15 €
Universitäten & Organisationen
(Informationsmaterial Digital, Informationsmaterial Print, Lehrmaterial Digital etc.)
ab 15 €
Redaktionell
(Bücher, Bücher: Sach- und Fachliteratur, Digitale Medien (redaktionell) etc.)
ab 30 €
Werbung
(Anzeigen, Aussenwerbung, Digitale Medien, Fernsehwerbung, Karten, Werbemittel, Zeitschriften etc.)
ab 55 €
Handelsprodukte
(bedruckte Textilie, Kalender, Postkarte, Grußkarte, Verpackung etc.)
ab 75 €
Pauschalpreise
Rechtepakete für die unbeschränkte Bildnutzung in Print oder Online
ab 495 €