Humpback whale song,wavelet graph
Bildnummer 11917435
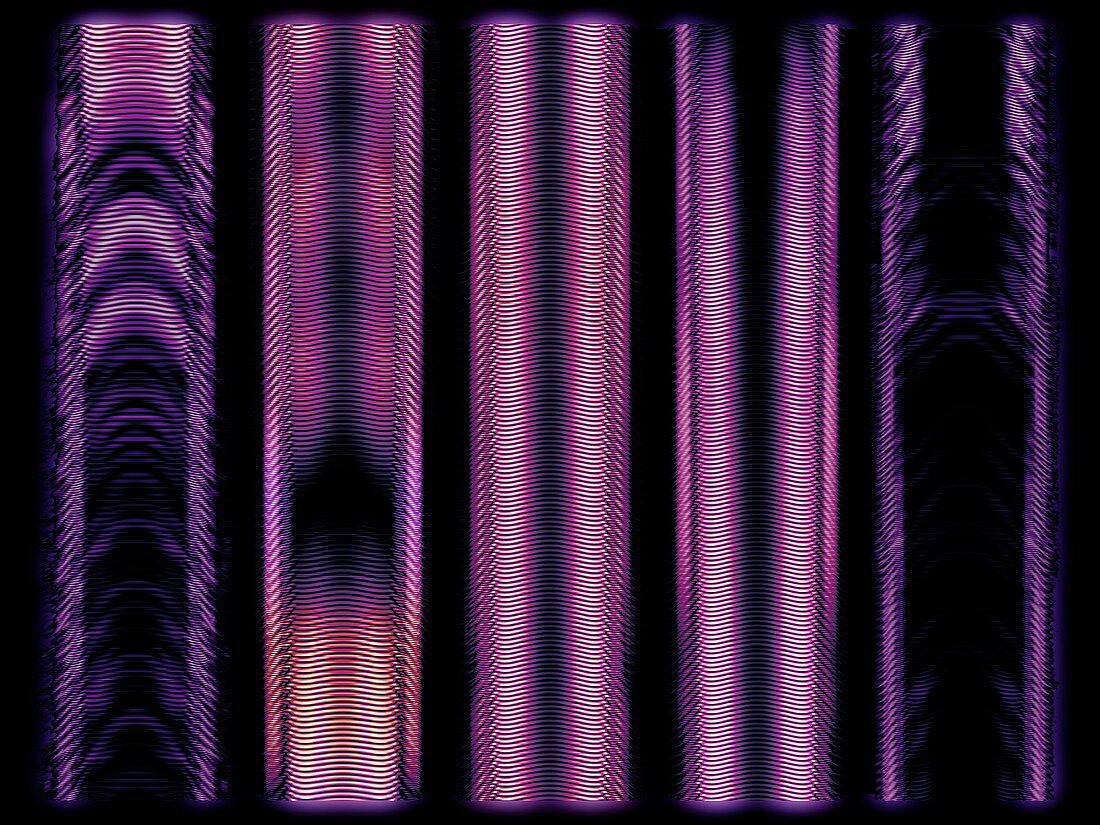
| Humpback whale (Megaptera novaeangliae) song,wavelet graph. This image was produced by converting the sound frequencies of a humpback whale song into a graph using a mathematical process known as wavelets. Wavelets reveal structure and detail that are not always visible in standard graphs of frequency over time (known as a spectrogram). This image has been plotted as a rectangular graph but wavelet graphs can also be in polar (circular) form. Male humpback whales produce songs during mating season. They consist of a variety of low frequency moans and cries that are repeated over many hours. The songs,which can travel thousands of kilometres underwater,can be recorded using underwater hydrophones. Image created by Mark Fischer from Aguasonic Acoustics,USA | |
| Lizenzart: | Lizenzpflichtig |
| Credit: | Science Photo Library / Aguasonic Acoustics |
| Bildgröße: | 4863 px × 3647 px |
| Modell-Rechte: | nicht erforderlich |
| Eigentums-Rechte: | nicht erforderlich |
| Restrictions: |
|
Preise für dieses Bild ab 15 €
Universitäten & Organisationen
(Informationsmaterial Digital, Informationsmaterial Print, Lehrmaterial Digital etc.)
ab 15 €
Redaktionell
(Bücher, Bücher: Sach- und Fachliteratur, Digitale Medien (redaktionell) etc.)
ab 30 €
Werbung
(Anzeigen, Aussenwerbung, Digitale Medien, Fernsehwerbung, Karten, Werbemittel, Zeitschriften etc.)
ab 55 €
Handelsprodukte
(bedruckte Textilie, Kalender, Postkarte, Grußkarte, Verpackung etc.)
ab 75 €
Pauschalpreise
Rechtepakete für die unbeschränkte Bildnutzung in Print oder Online
ab 495 €
Keywords
- Akustik,
- akustisch,
- Anruf,
- Biologie,
- biologisch,
- Fauna,
- Frequenzen,
- Illustration,
- Klang,
- Kommunikation,
- Kunstwerk,
- Lied,
- Mark Fischer,
- Mathematik,
- mathematisch,
- Meeresbiologie,
- Meeressäugetier,
- Natur,
- Physik,
- physisch,
- rechteckiger Graph,
- Säugetier,
- Schallwellen,
- technologisch,
- Tier,
- Tierwelt,
- Tonaufnahme,
- Walakustik,
- Walgesang,
- Wavelet-Transformation,
- Wellen,
- wissenschaftliche Kunst,
- Zoologie,
- zoologisch