Bird song,wavelet graph
Bildnummer 11916456
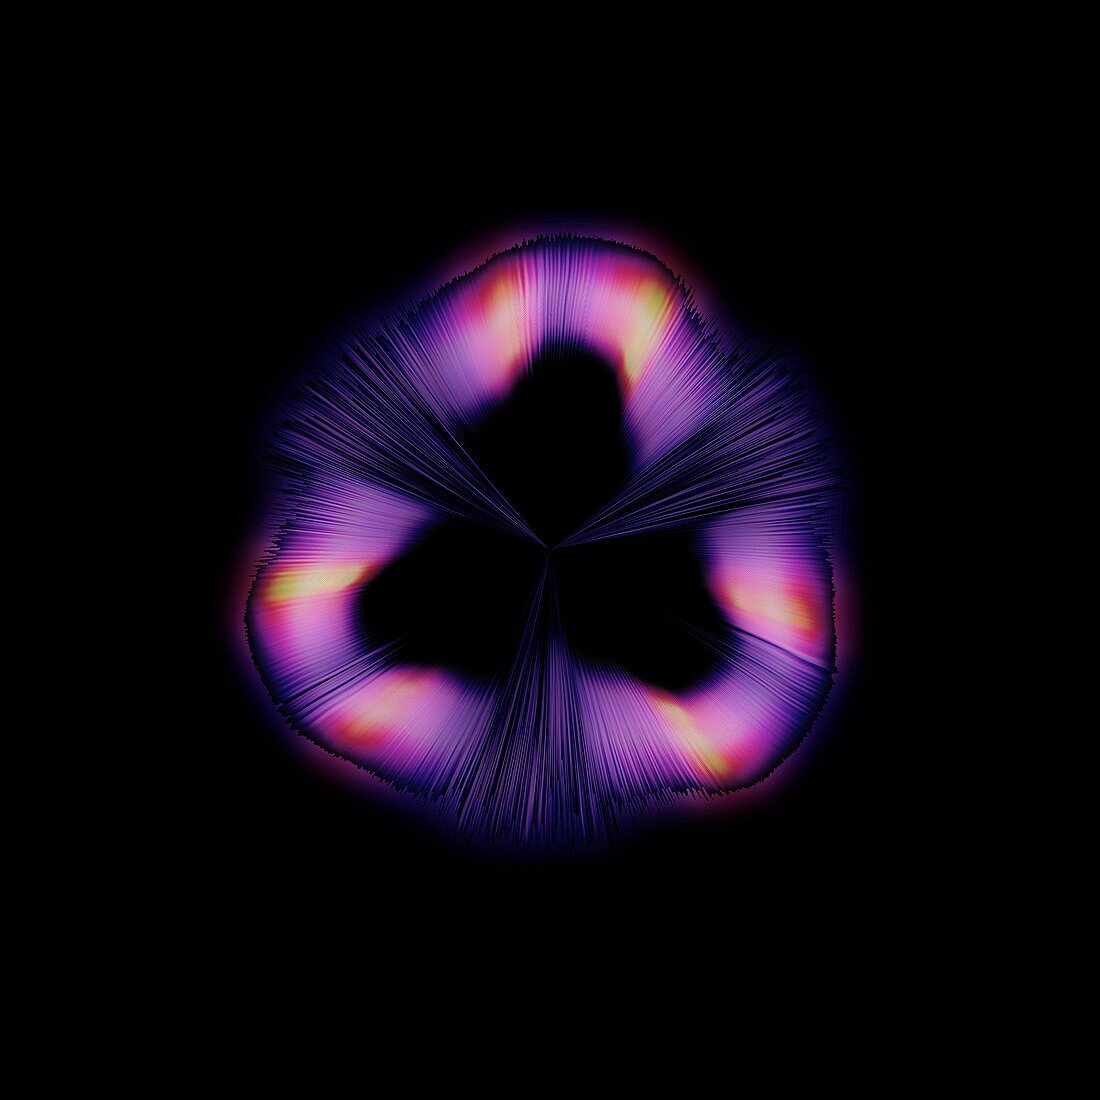
| Bird song,wavelet graph. This image was produced by converting the frequencies of sounds made by birds singing,into a graph using a mathematical process known as wavelets. Wavelets reveal structure and detail that are not always visible in standard graphs of frequency over time (known as a spectrogram). This image has been plotted as a polar (circular) graph,but wavelets can also be inrectangular form. Image created by Mark Fischer from Aguasonic Acoustics,USA | |
| Lizenzart: | Lizenzpflichtig |
| Credit: | Science Photo Library / Aguasonic Acoustics |
| Bildgröße: | 4800 px × 4800 px |
| Modell-Rechte: | nicht erforderlich |
| Eigentums-Rechte: | nicht erforderlich |
| Restrictions: |
|
Preise für dieses Bild ab 15 €
Universitäten & Organisationen
(Informationsmaterial Digital, Informationsmaterial Print, Lehrmaterial Digital etc.)
ab 15 €
Redaktionell
(Bücher, Bücher: Sach- und Fachliteratur, Digitale Medien (redaktionell) etc.)
ab 30 €
Werbung
(Anzeigen, Aussenwerbung, Digitale Medien, Fernsehwerbung, Karten, Werbemittel, Zeitschriften etc.)
ab 55 €
Handelsprodukte
(bedruckte Textilie, Kalender, Postkarte, Grußkarte, Verpackung etc.)
ab 75 €
Pauschalpreise
Rechtepakete für die unbeschränkte Bildnutzung in Print oder Online
ab 495 €
Keywords
- Akustik,
- akustisch,
- Anruf,
- Biologie,
- biologisch,
- Blau,
- Computergrafik,
- Fauna,
- Frequenzen,
- Gelb,
- Illustration,
- Ingenieurwesen,
- Klang,
- Kommunikation,
- Kunstwerk,
- Lied,
- Mark Fischer,
- Mathematik,
- mathematisch,
- Natur,
- Passerine,
- Physik,
- physisch,
- rechteckiger Graph,
- Schallwellen,
- Technologie,
- technologisch,
- Tier,
- Tierwelt,
- Tonaufnahme,
- Vogel,
- Vogelgeräusch,
- Vogelgesang,
- Vogelgezwitscher,
- Wavelet-Transformation,
- Wellen,
- wissenschaftliche Kunst,
- Zoologie,
- zoologisch