Houses and road,thermogram
Bildnummer 11900966
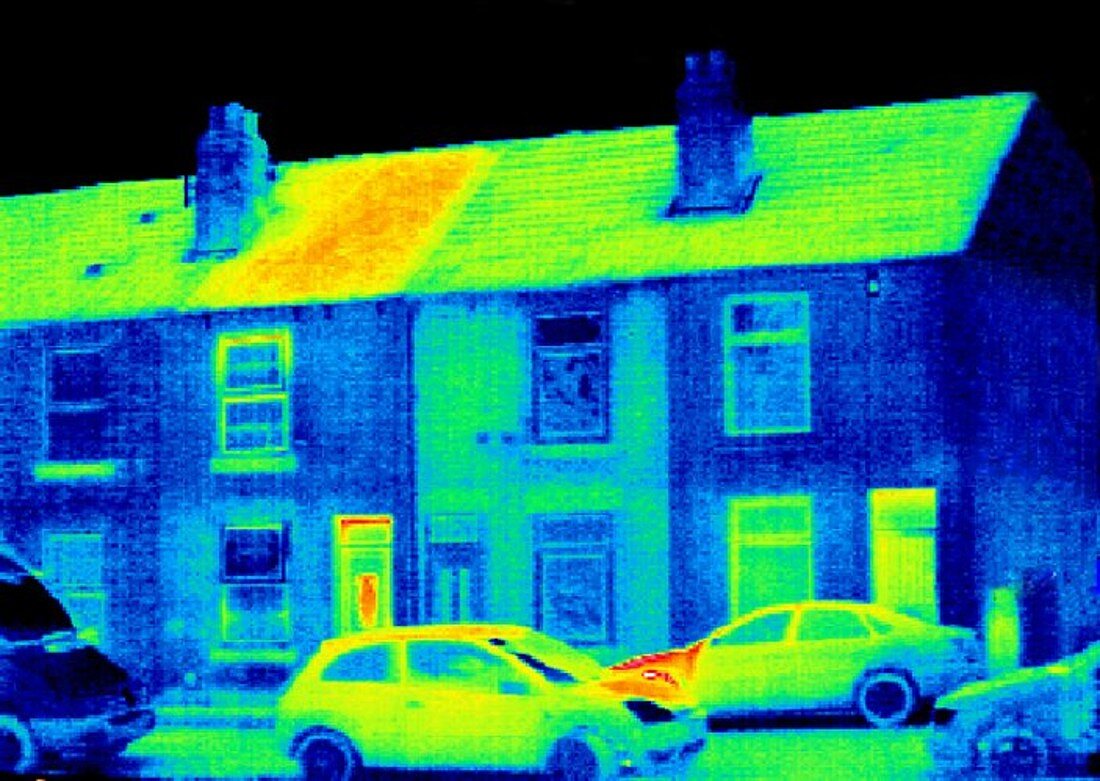
| Houses and road,thermogram. A thermogram shows the variation in temperature on the surface of an object,measured by the long-wave infrared radiation it emits. The temperature scale is colour-coded and runs from black (coldest) through blue,green,yellow and orange to red (warmest). This imaging technique can be used to check the energy efficiency of buildings. The roof of the house at left appears red because heat is being lost from its loft space | |
| Lizenzart: | Lizenzpflichtig |
| Credit: | Science Photo Library / McConnell, Tony |
| Bildgröße: | 703 px × 499 px |
| Modell-Rechte: | nicht erforderlich |
| Eigentums-Rechte: | nicht erforderlich |
| Restrictions: | - |
Preise für dieses Bild ab 15 €
Universitäten & Organisationen
(Informationsmaterial Digital, Informationsmaterial Print, Lehrmaterial Digital etc.)
ab 15 €
Redaktionell
(Bücher, Bücher: Sach- und Fachliteratur, Digitale Medien (redaktionell) etc.)
ab 30 €
Werbung
(Anzeigen, Aussenwerbung, Digitale Medien, Fernsehwerbung, Karten, Werbemittel, Zeitschriften etc.)
ab 55 €
Handelsprodukte
(bedruckte Textilie, Kalender, Postkarte, Grußkarte, Verpackung etc.)
ab 75 €
Pauschalpreise
Rechtepakete für die unbeschränkte Bildnutzung in Print oder Online
ab 495 €
Keywords
- Architektur,
- Auto,
- Autos,
- Bautechnologie,
- CO2-Fußabdruck,
- Dach,
- Dachboden,
- Dachböden,
- Dächer,
- Design,
- Domestik,
- Effizienz,
- Fahrzeug,
- Gebäude,
- Gehäuse,
- geparkt,
- Haus,
- heiß,
- Hitze,
- infrarot,
- Isolierung,
- Klimawandel,
- langwellige Strahlung,
- Motor,
- Parken,
- Reihe,
- Straße,
- Technologie,
- technologisch,
- Thermografie,
- Thermogramm,
- Umweltwissenschaften,
- Warm,
- Wohn-,
- Zentralheizung