Flats,thermogram
Bildnummer 11900896
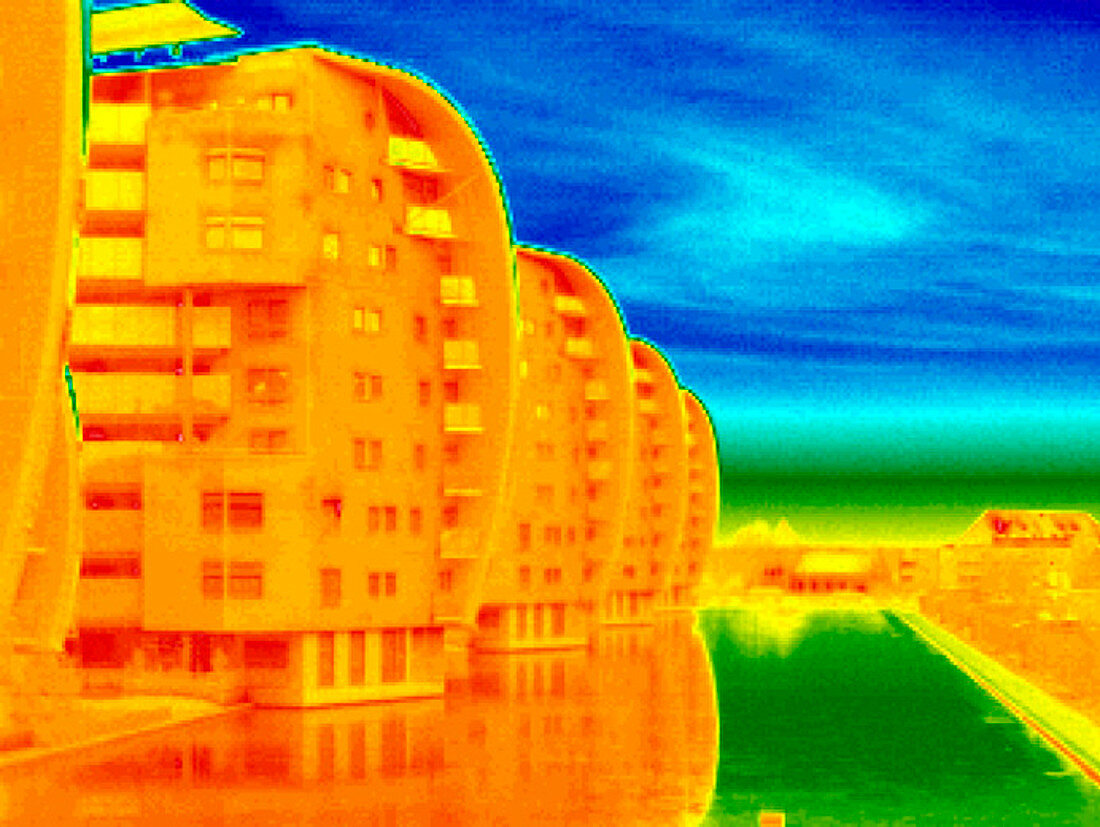
| Flats. Thermogram of blocks of flats by a canal. A thermogram shows variation in temperature on the surface of an object,measured by the long-wave infrared radiation it emits. The temperature scale is colour-coded and runs from dark blue (coldest,-41 degrees Celsius) through green,yellow and orange to red (warmest,3 degrees Celsius).This imaging technique can be used to check the energy efficiency of buildings. The areas that appear hotter in a thermogram are where heat is being wasted | |
| Lizenzart: | Lizenzpflichtig |
| Credit: | Science Photo Library / T-Service |
| Bildgröße: | 692 px × 520 px |
| Modell-Rechte: | nicht erforderlich |
| Eigentums-Rechte: | nicht erforderlich |
| Restrictions: |
|
Preise für dieses Bild ab 15 €
Universitäten & Organisationen
(Informationsmaterial Digital, Informationsmaterial Print, Lehrmaterial Digital etc.)
ab 15 €
Redaktionell
(Bücher, Bücher: Sach- und Fachliteratur, Digitale Medien (redaktionell) etc.)
ab 30 €
Werbung
(Anzeigen, Aussenwerbung, Digitale Medien, Fernsehwerbung, Karten, Werbemittel, Zeitschriften etc.)
ab 55 €
Handelsprodukte
(bedruckte Textilie, Kalender, Postkarte, Grußkarte, Verpackung etc.)
ab 75 €
Pauschalpreise
Rechtepakete für die unbeschränkte Bildnutzung in Print oder Online
ab 495 €