Air traffic
Bildnummer 11897824
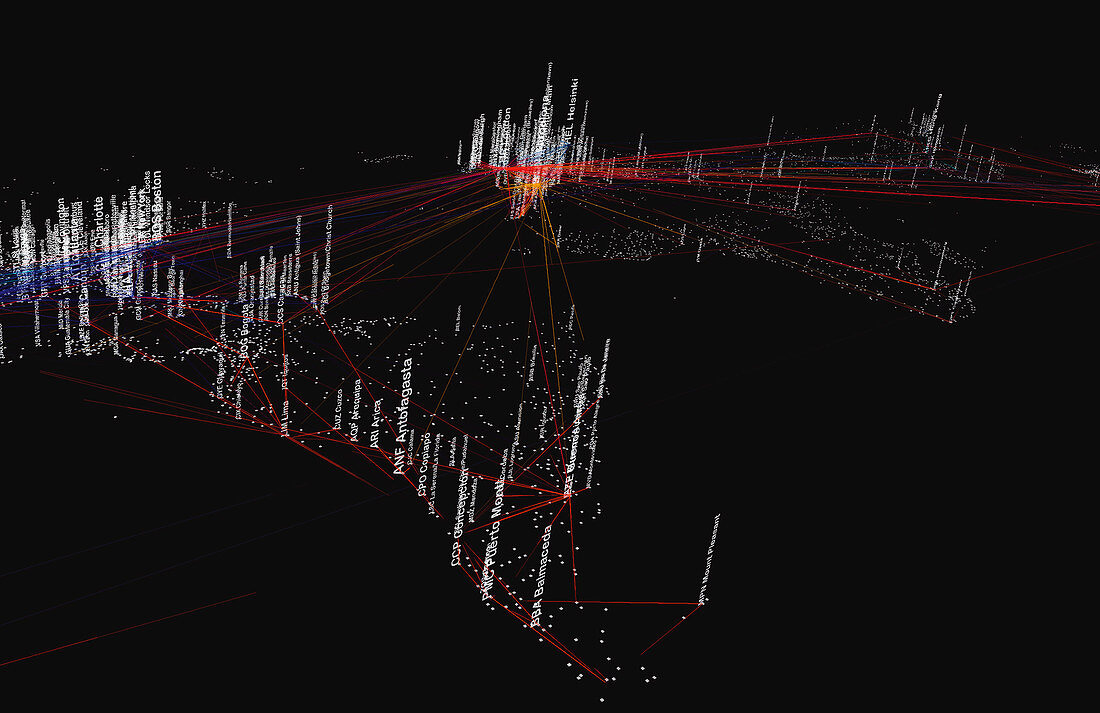
| World air traffic,computer artwork. This visualisation is based on the flight schedules of over 30 airline companies. Square dots represent airports and the vertical words are airport names with their international standard abbreviation. The height of the airport name represents the number of departures from that airport. The lines connecting the airports represent the flight route taken by airplanes. This image shows the progress of flights at one particular moment during the day. North and South America are centre left to centre bottom,Europe is centre top,Africa and Asia is middle to far right. Image created by Christian Riekoff using Flighttracker software | |
| Lizenzart: | Lizenzpflichtig |
| Credit: | Science Photo Library / Riekoff, Christian |
| Bildgröße: | 4724 px × 3062 px |
| Modell-Rechte: | nicht erforderlich |
| Eigentums-Rechte: | nicht erforderlich |
| Restrictions: | - |
Preise für dieses Bild ab 15 €
Universitäten & Organisationen
(Informationsmaterial Digital, Informationsmaterial Print, Lehrmaterial Digital etc.)
ab 15 €
Redaktionell
(Bücher, Bücher: Sach- und Fachliteratur, Digitale Medien (redaktionell) etc.)
ab 30 €
Werbung
(Anzeigen, Aussenwerbung, Digitale Medien, Fernsehwerbung, Karten, Werbemittel, Zeitschriften etc.)
ab 55 €
Handelsprodukte
(bedruckte Textilie, Kalender, Postkarte, Grußkarte, Verpackung etc.)
ab 75 €
Pauschalpreise
Rechtepakete für die unbeschränkte Bildnutzung in Print oder Online
ab 495 €
Keywords
- Abfahrt,
- Computer gerendert,
- Computergeneriert,
- Computergrafik,
- Daten,
- digitale Informationen,
- europäisch,
- Flug,
- Flughafen,
- Flugzeug,
- Illustration,
- Infografik,
- Infografiken,
- International,
- Karte,
- komplexe Daten,
- komplexe Visualisierung,
- komplexes Netzwerk,
- Konnektivität,
- Kunstwerk,
- Luftfahrt,
- Netzwerk,
- Passagierflugzeug,
- Route,
- Routen,
- Technologie,
- technologisch,
- Transport,
- Verbindung,
- Verbindungen,
- visuell,
- visuelle Komplexität,
- Welt,
- weltweit