Cooling towers,thermogram
Bildnummer 11892171
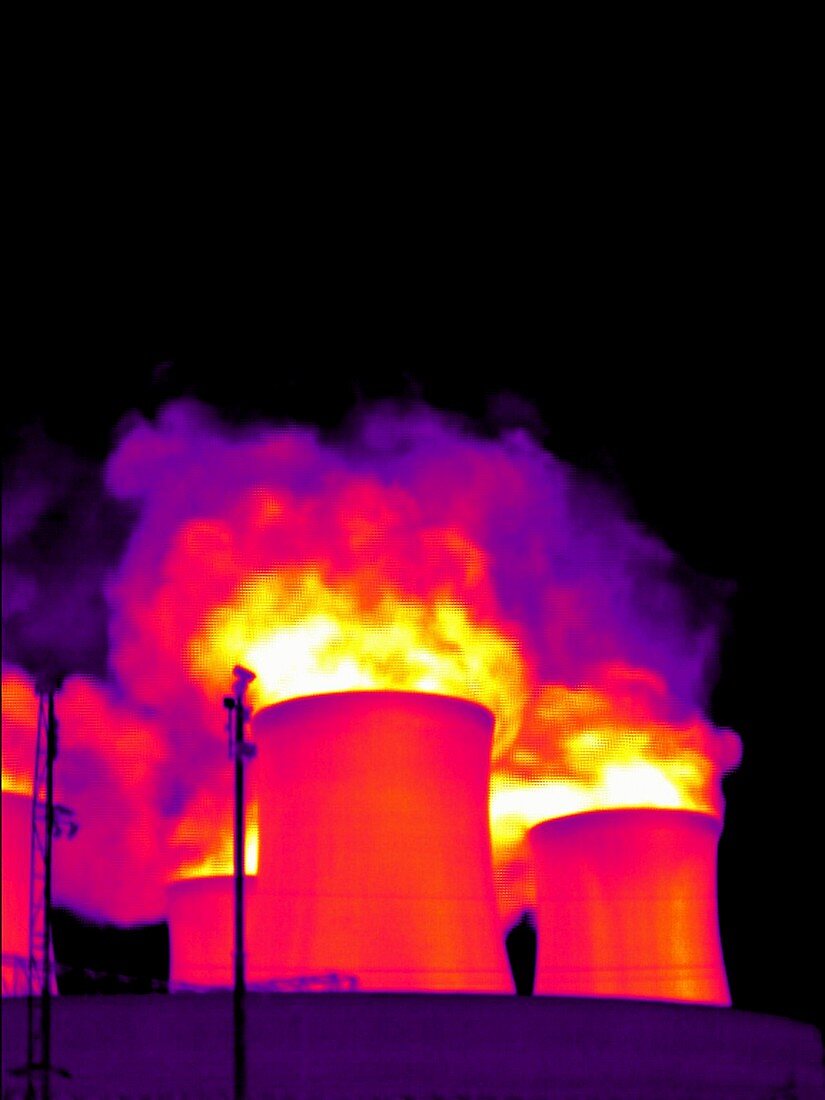
| Cooling towers. Thermogram of water vapour rising out of cooling towers at a power station. A thermogram shows the variation in temperature on the surface of an object,measured by the long-wave infrared radiation it emits. The temperature scale is colour-coded and runs from black (coldest) through violet,pink,red,orange and yellow to white (warmest) | |
| Lizenzart: | Lizenzpflichtig |
| Credit: | Science Photo Library / McConnell, Tony |
| Bildgröße: | 1156 px × 1541 px |
| Modell-Rechte: | nicht erforderlich |
| Eigentums-Rechte: | nicht erforderlich |
| Restrictions: | - |
Preise für dieses Bild ab 15 €
Universitäten & Organisationen
(Informationsmaterial Digital, Informationsmaterial Print, Lehrmaterial Digital etc.)
ab 15 €
Redaktionell
(Bücher, Bücher: Sach- und Fachliteratur, Digitale Medien (redaktionell) etc.)
ab 30 €
Werbung
(Anzeigen, Aussenwerbung, Digitale Medien, Fernsehwerbung, Karten, Werbemittel, Zeitschriften etc.)
ab 55 €
Handelsprodukte
(bedruckte Textilie, Kalender, Postkarte, Grußkarte, Verpackung etc.)
ab 75 €
Pauschalpreise
Rechtepakete für die unbeschränkte Bildnutzung in Print oder Online
ab 495 €