EcoMeter daily usage graph
Bildnummer 11889801
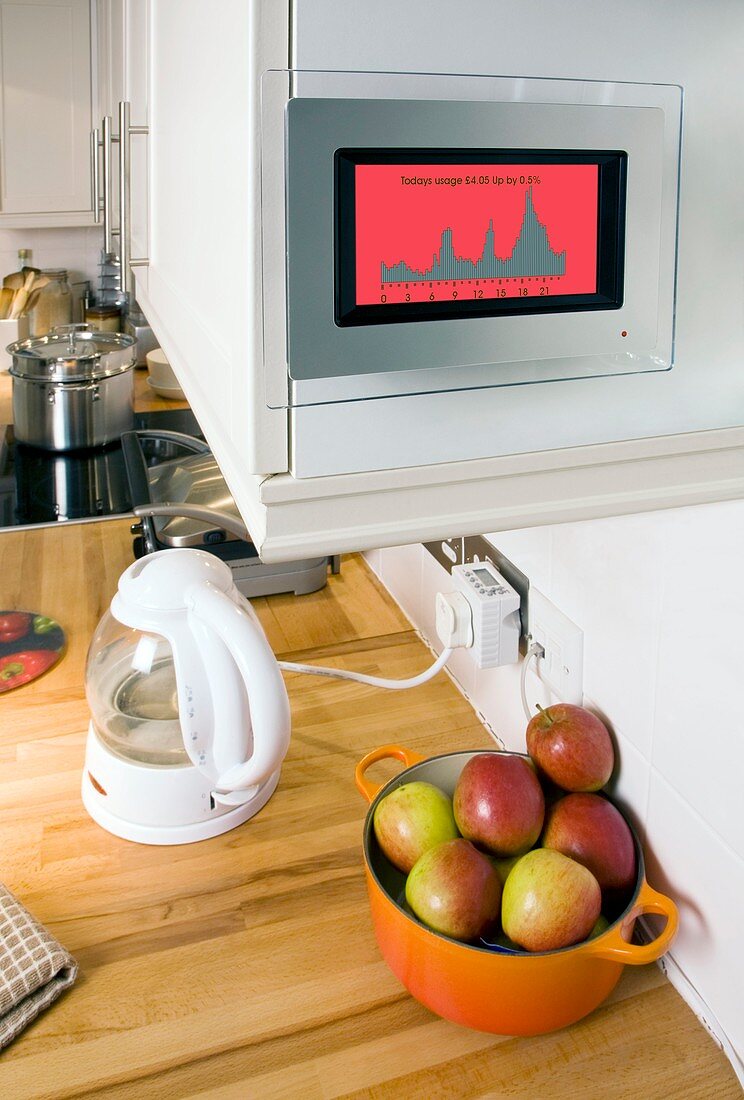
| EcoMeter daily usage graph. EcoDisplay showing the household's daily energy consumption as a graph (coloured red,meaning 'high and increasing'). The household has been installed with an EcoMeter,a device that can keep track of energy use by monitoring gas,water,electrical circuits and individual appliances. Here,the kettle on the worktop has been fitted with an EcoSocket (lower centre). This information can help the consumer to alter behaviour and implement energy saving measures | |
| Lizenzart: | Lizenzpflichtig |
| Credit: | Science Photo Library / Rapson, Paul |
| Bildgröße: | 3450 px × 5102 px |
| Modell-Rechte: | nicht erforderlich |
| Eigentums-Rechte: | nicht erforderlich |
| Restrictions: | - |
Preise für dieses Bild ab 15 €
Universitäten & Organisationen
(Informationsmaterial Digital, Informationsmaterial Print, Lehrmaterial Digital etc.)
ab 15 €
Redaktionell
(Bücher, Bücher: Sach- und Fachliteratur, Digitale Medien (redaktionell) etc.)
ab 30 €
Werbung
(Anzeigen, Aussenwerbung, Digitale Medien, Fernsehwerbung, Karten, Werbemittel, Zeitschriften etc.)
ab 55 €
Handelsprodukte
(bedruckte Textilie, Kalender, Postkarte, Grußkarte, Verpackung etc.)
ab 75 €
Pauschalpreise
Rechtepakete für die unbeschränkte Bildnutzung in Print oder Online
ab 495 €
Keywords
- Anzeige,
- Ausrüstung,
- bewusst,
- Bewusstsein,
- Domestik,
- drinnen,
- effizient,
- Effizienz,
- Elektrisch,
- Elektrizität,
- Gas,
- Gebrauch,
- Gerät,
- Haus,
- Haushalt,
- hoch,
- Information,
- innerhalb,
- Kessel,
- Küche,
- Leistung,
- Lesen,
- Mauer,
- Messung,
- Monitor,
- rot,
- Steckdose,
- Stecker,
- Stillleben,
- täglich,
- Technologie,
- technologisch,
- Überwachung,
- Umwelt,
- Umweltfreundlich,
- Umweltwissenschaften,
- Wasser,
- zeigend,
- Zuhause