Doppler shift of spectral lines
Bildnummer 11887186
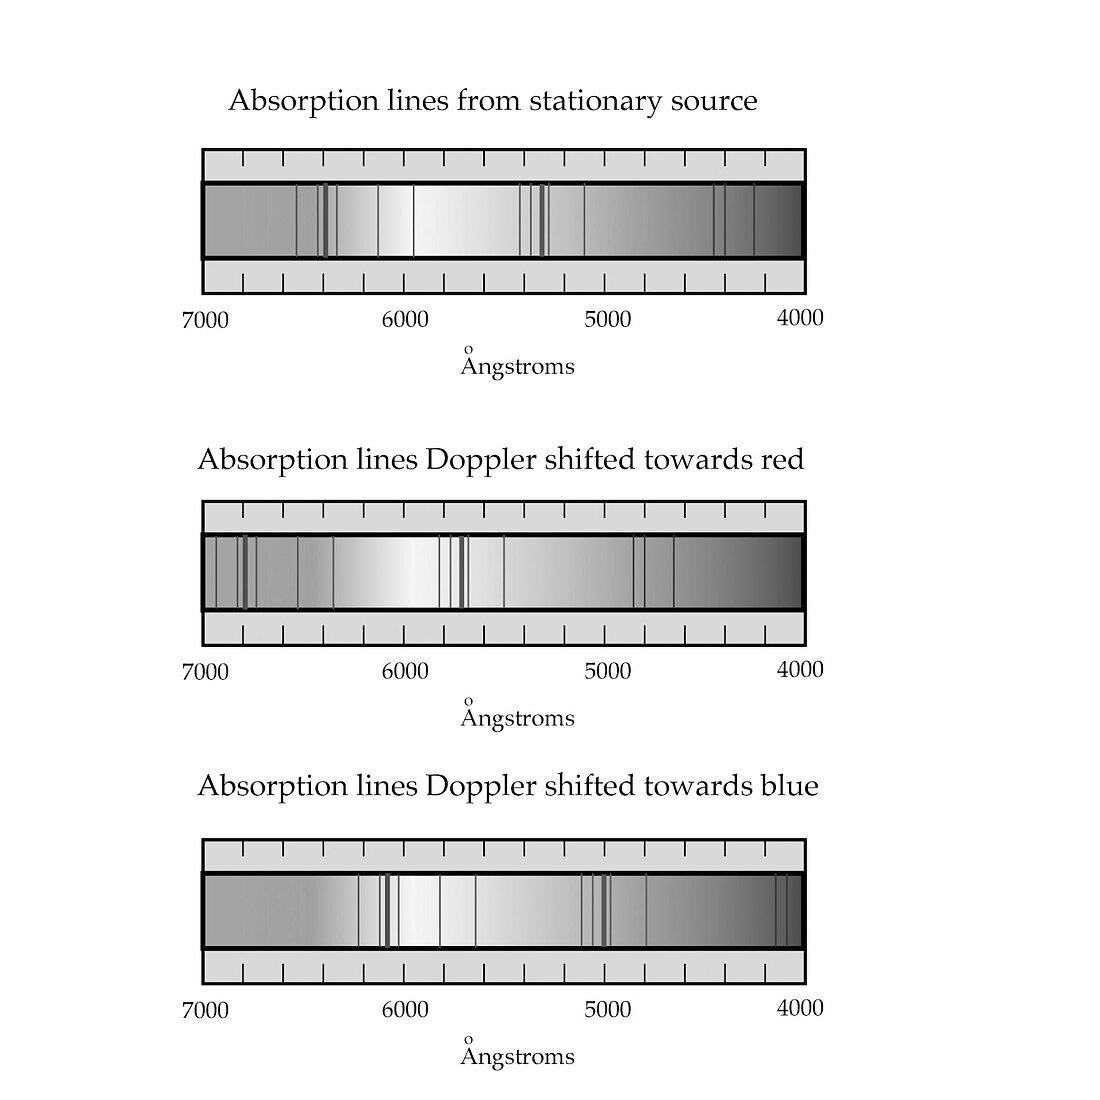
| Doppler shift of spectral lines. Diagram of three spectra with the changing positions of absorption lines (dark bars) in light from stationary (top),receding (centre) and approaching (lower) stars. The spectra show the wavelength range over the visible part of the electromagnetic spectrum,from red (7000 Angstroms) to blue (4000 Angstroms). The absorption lines are red-shifted for objects that are receding and blue-shifted for objects that are approaching. The effect,noticeable when the speed is comparable to that of light,is used to measure the recession speeds of distant galaxies,and help calculate the age of the universe | |
| Lizenzart: | Lizenzpflichtig |
| Credit: | Science Photo Library / Lomberg, Jon |
| Bildgröße: | 1500 px × 1500 px |
| Modell-Rechte: | nicht erforderlich |
| Eigentums-Rechte: | nicht erforderlich |
| Restrictions: | - |
Preise für dieses Bild ab 15 €
Universitäten & Organisationen
(Informationsmaterial Digital, Informationsmaterial Print, Lehrmaterial Digital etc.)
ab 15 €
Redaktionell
(Bücher, Bücher: Sach- und Fachliteratur, Digitale Medien (redaktionell) etc.)
ab 30 €
Werbung
(Anzeigen, Aussenwerbung, Digitale Medien, Fernsehwerbung, Karten, Werbemittel, Zeitschriften etc.)
ab 55 €
Handelsprodukte
(bedruckte Textilie, Kalender, Postkarte, Grußkarte, Verpackung etc.)
ab 75 €
Pauschalpreise
Rechtepakete für die unbeschränkte Bildnutzung in Print oder Online
ab 495 €