Computer simulation of the Sun's oscillations
Bildnummer 11884057
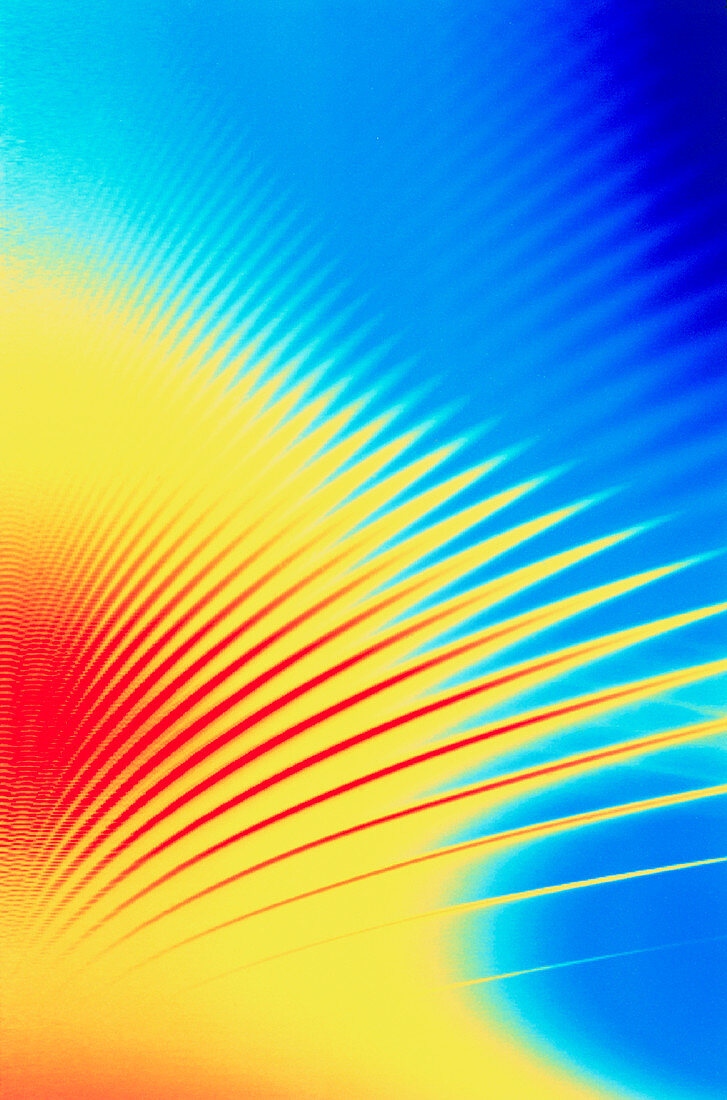
| Sun's oscillations. Graph of the Sun's oscilla- tions due to resonating soundwaves,drawn using data from the SOHO (Solar Heliospheric Observa- tory) satellite. The vertical scale represents frequency and the horizontal axis represents an inverse function of wavelength. The power density of waves with different combinations of these two properties is colour-coded from low (dark blue) through light blue,green & yellow to red (high). These oscillations reveal details of the Sun's internal composition & structure. Image produced by the Michelson Doppler Imager instrument | |
| Lizenzart: | Lizenzpflichtig |
| Credit: | Science Photo Library / ESA |
| Bildgröße: | 3414 px × 5163 px |
| Modell-Rechte: | nicht erforderlich |
| Eigentums-Rechte: | nicht erforderlich |
| Restrictions: |
|
Preise für dieses Bild ab 15 €
Universitäten & Organisationen
(Informationsmaterial Digital, Informationsmaterial Print, Lehrmaterial Digital etc.)
ab 15 €
Redaktionell
(Bücher, Bücher: Sach- und Fachliteratur, Digitale Medien (redaktionell) etc.)
ab 30 €
Werbung
(Anzeigen, Aussenwerbung, Digitale Medien, Fernsehwerbung, Karten, Werbemittel, Zeitschriften etc.)
ab 55 €
Handelsprodukte
(bedruckte Textilie, Kalender, Postkarte, Grußkarte, Verpackung etc.)
ab 75 €
Pauschalpreise
Rechtepakete für die unbeschränkte Bildnutzung in Print oder Online
ab 495 €