Thermogram of feet wearing trainers
Bildnummer 11877007
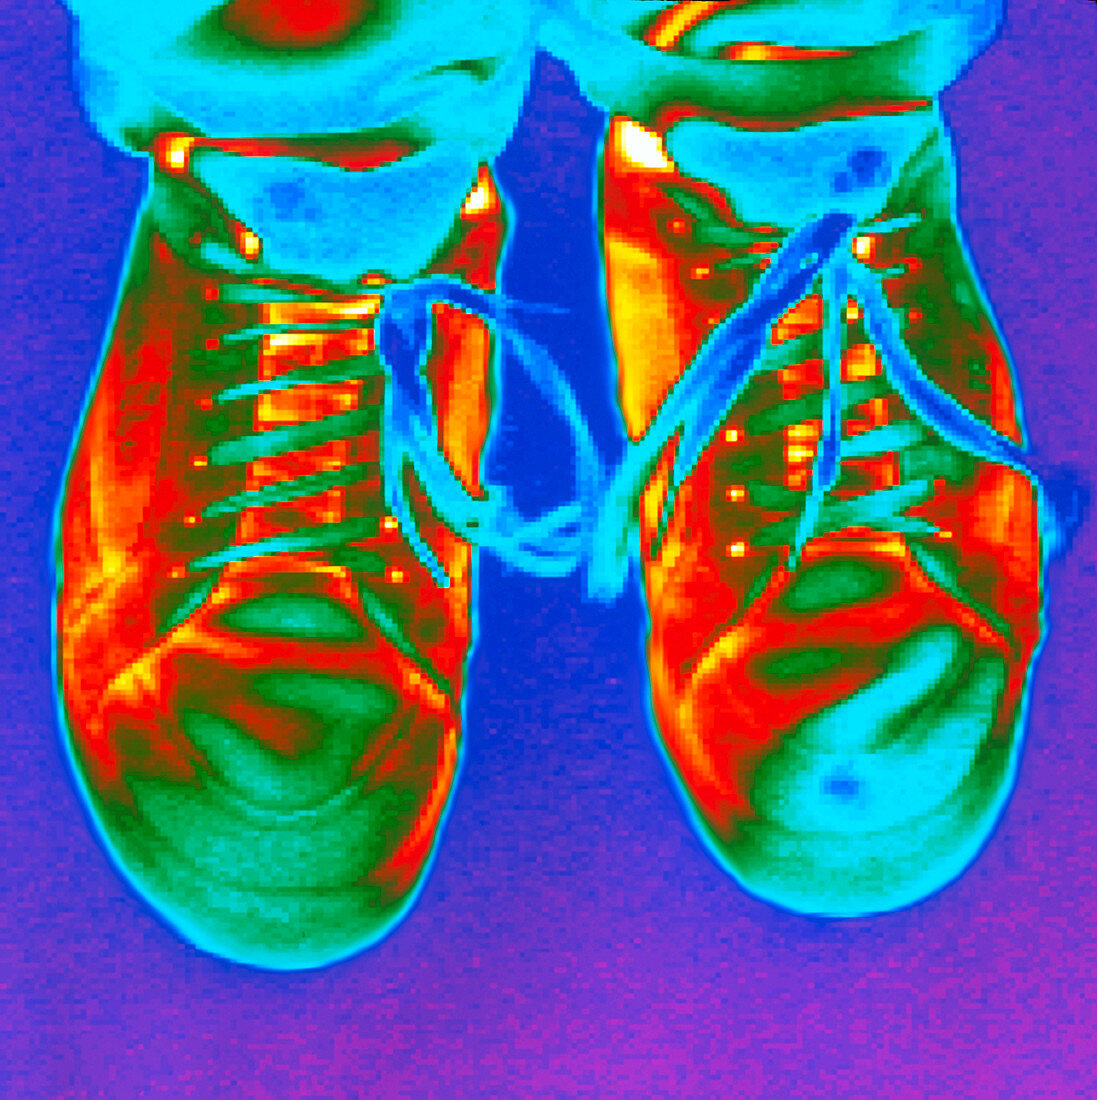
| Feet in trainers. Thermogram of a person's feet wearing trainers. The image shows the variation of surface temperature. The temperature scale runs from red (warmest) through yellow,green,cyan and blue to mauve (coldest). Thermography is a technique for visualising the temperature of surfaces by recording their emission of long- wavelength infrared radiation. This heat radiation is detected electronically and displayed with different colours representing different temperatures | |
| Lizenzart: | Lizenzpflichtig |
| Credit: | Science Photo Library / Tucker, Dr. Arthur |
| Bildgröße: | 3053 px × 3061 px |
| Modell-Rechte: | nicht erforderlich |
| Eigentums-Rechte: | nicht erforderlich |
| Restrictions: | - |
Preise für dieses Bild ab 15 €
Universitäten & Organisationen
(Informationsmaterial Digital, Informationsmaterial Print, Lehrmaterial Digital etc.)
ab 15 €
Redaktionell
(Bücher, Bücher: Sach- und Fachliteratur, Digitale Medien (redaktionell) etc.)
ab 30 €
Werbung
(Anzeigen, Aussenwerbung, Digitale Medien, Fernsehwerbung, Karten, Werbemittel, Zeitschriften etc.)
ab 55 €
Handelsprodukte
(bedruckte Textilie, Kalender, Postkarte, Grußkarte, Verpackung etc.)
ab 75 €
Pauschalpreise
Rechtepakete für die unbeschränkte Bildnutzung in Print oder Online
ab 495 €