Thermogram of a man smoking a pipe
Bildnummer 11876986
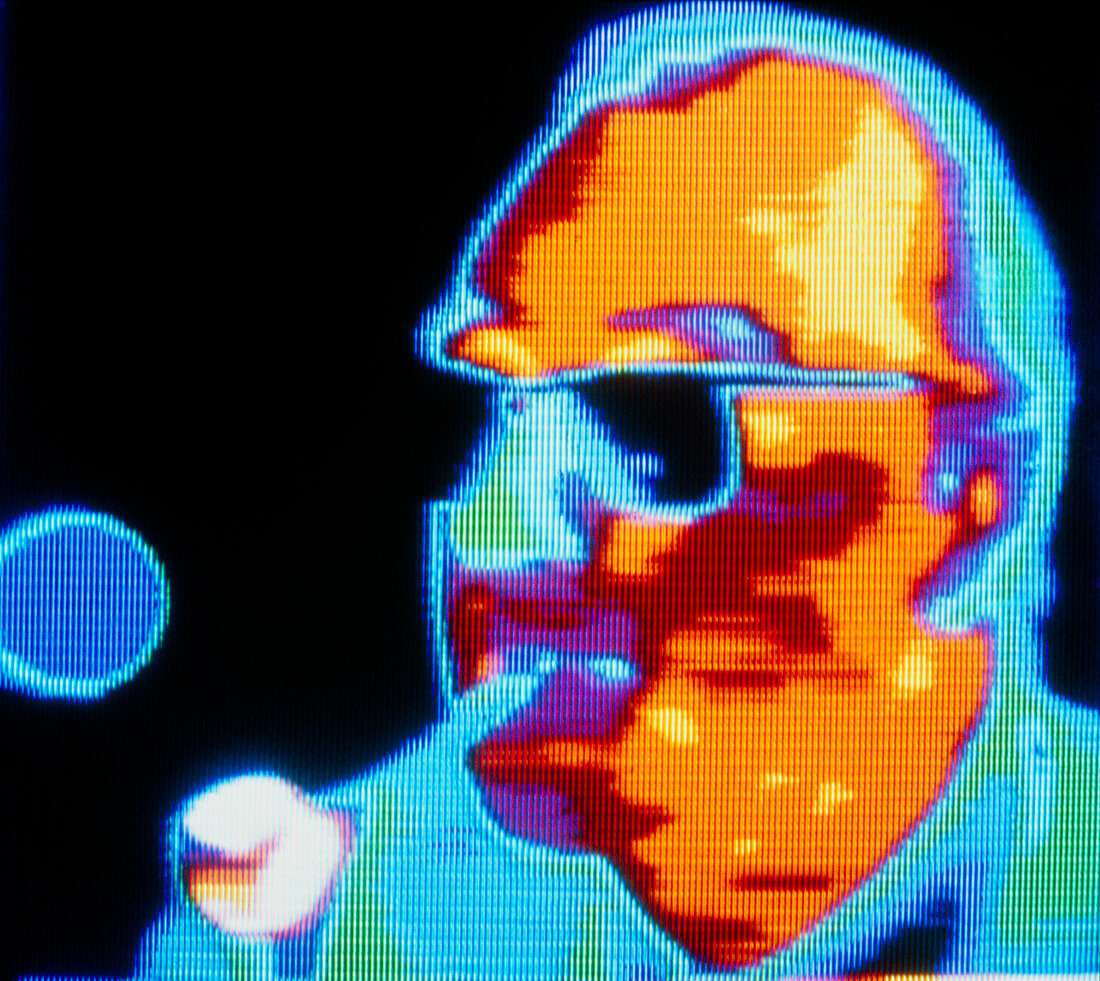
| Thermogram of a man smoking a pipe,showing an increase in facial skin temperature. Thermography maps the pattern of heat distribution over the body surface to give a colour-coded image that shows variation in temperature. In this image,the temperature reference disc at left is calibrated at 32 degrees C.,with each colour representing a step of 0.5 degrees C. White areas are hottest (the pipe bowl),varying through yellow,orange,purple,green to blue/black (coolest) | |
| Lizenzart: | Lizenzpflichtig |
| Credit: | Science Photo Library |
| Bildgröße: | 4476 px × 3992 px |
| Modell-Rechte: | nicht erforderlich |
| Eigentums-Rechte: | nicht erforderlich |
| Restrictions: | - |
Preise für dieses Bild ab 15 €
Universitäten & Organisationen
(Informationsmaterial Digital, Informationsmaterial Print, Lehrmaterial Digital etc.)
ab 15 €
Redaktionell
(Bücher, Bücher: Sach- und Fachliteratur, Digitale Medien (redaktionell) etc.)
ab 30 €
Werbung
(Anzeigen, Aussenwerbung, Digitale Medien, Fernsehwerbung, Karten, Werbemittel, Zeitschriften etc.)
ab 55 €
Handelsprodukte
(bedruckte Textilie, Kalender, Postkarte, Grußkarte, Verpackung etc.)
ab 75 €
Pauschalpreise
Rechtepakete für die unbeschränkte Bildnutzung in Print oder Online
ab 495 €