Obese woman,thermogram
Bildnummer 11841693
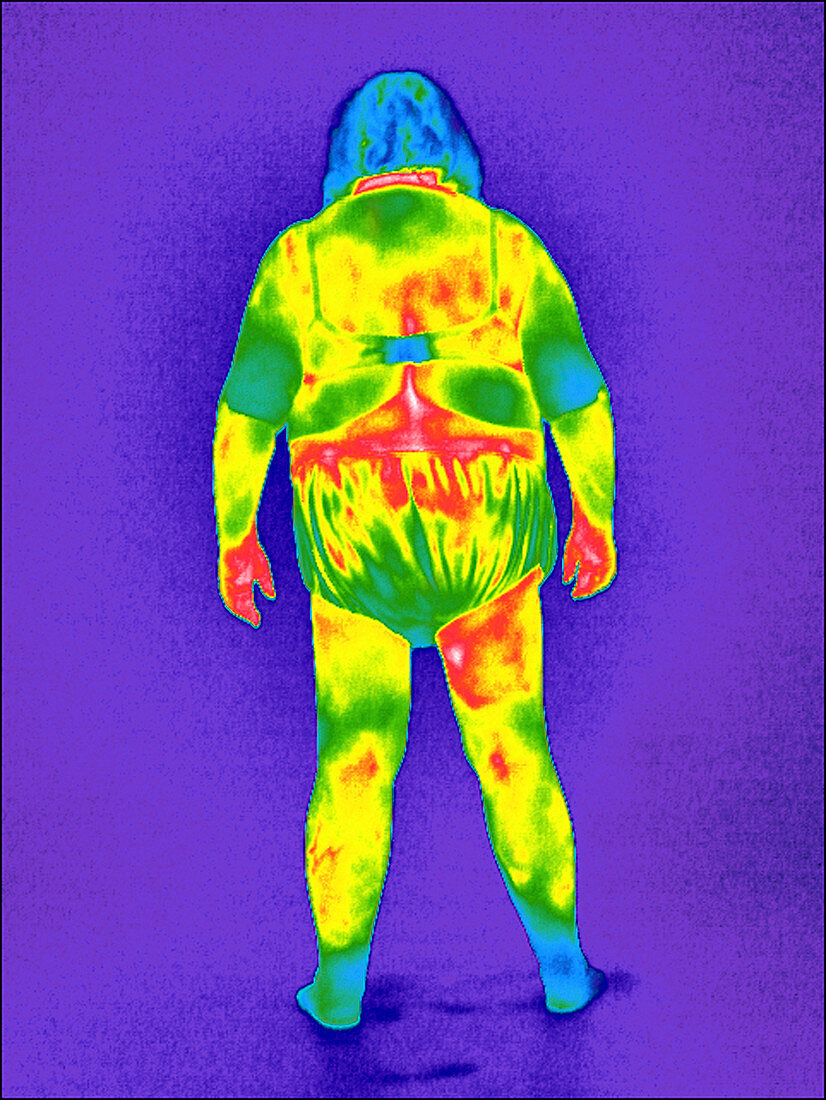
| MODEL RELEASED. Obese woman,thermogram. Rear view of an obese woman. A thermogram shows the variation in temperature on the surface of an object,measured by the long-wave infrared radiation it emits. The temperature scale is colour-coded and runs from purple (coldest) through blue,green,yellow and red to white (warmest). Temperature regulation is more difficult in obese people and sweating is increased (white areas). Blood flow to the lower legs and feet is reduced because of poor circulation,causing them to be cooler than other parts of the body. Obesity increases the risks of developing many conditions,including heart disease,diabetes,osteoarthritis and high blood pressure | |
| Lizenzart: | Lizenzpflichtig |
| Credit: | Science Photo Library / McConnell, Tony |
| Bildgröße: | 2000 px × 2664 px |
| Modell-Rechte: | vorhanden |
| Eigentums-Rechte: | nicht erforderlich |
| Restrictions: | - |
Preise für dieses Bild ab 15 €
Universitäten & Organisationen
(Informationsmaterial Digital, Informationsmaterial Print, Lehrmaterial Digital etc.)
ab 15 €
Redaktionell
(Bücher, Bücher: Sach- und Fachliteratur, Digitale Medien (redaktionell) etc.)
ab 30 €
Werbung
(Anzeigen, Aussenwerbung, Digitale Medien, Fernsehwerbung, Karten, Werbemittel, Zeitschriften etc.)
ab 55 €
Handelsprodukte
(bedruckte Textilie, Kalender, Postkarte, Grußkarte, Verpackung etc.)
ab 75 €
Pauschalpreise
Rechtepakete für die unbeschränkte Bildnutzung in Print oder Online
ab 495 €
Keywords
- adipös,
- Adipositas,
- Distribution,
- einer,
- eingefärbt,
- Erwachsene,
- farbig,
- Fett,
- Frau,
- gefärbt,
- Gesundheitswesen,
- Haut,
- Hinter,
- infrarot,
- ir,
- Isolierung,
- Kondition,
- Krankheit,
- Kreislauf,
- Medizin,
- medizinisch,
- Mensch,
- Menschen,
- mittleren Alters,
- Person,
- Rückansicht,
- Rücken,
- Schultern,
- Single,
- Stehen,
- Störung,
- Temperatur,
- Thermografie,
- Thermogramm,
- Übergewicht,
- ungesund,
- Unterwäsche,
- Weiblich