Rheumatoid arthritis
Bildnummer 11835004
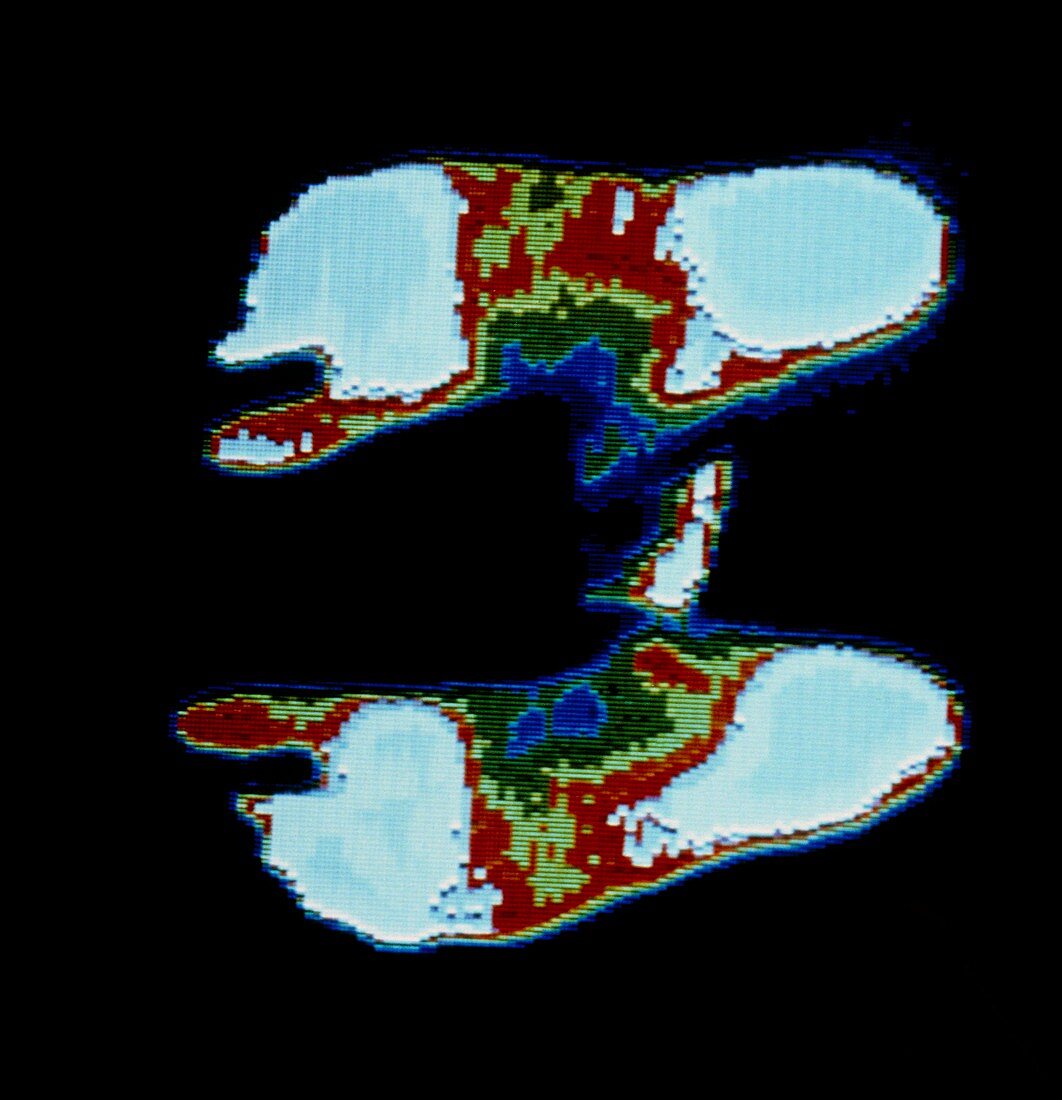
| Thermogram of the soles of a person's feet suffering from rheumatoid arthritis affecting the ankle and toe joints. A thermogram is a colour- coded map of temperature distribution over the body surface. The colour coding shows variation in temperature,ranging in steps from blue-black (coolest) to white (warmest areas). Alterations in skin temperature are characteristic of certain diseases; inflammation in rheumatoid arthritis may give rise to temperature increases of up to 2 degrees C. The symmetrical areas of inflammation over both feet are characteristic of rheumatoid arthritis | |
| Lizenzart: | Lizenzpflichtig |
| Credit: | Science Photo Library / DR RAY CLARKE & MERVYN GOFF |
| Bildgröße: | 4109 px × 4255 px |
| Modell-Rechte: | nicht erforderlich |
| Eigentums-Rechte: | nicht erforderlich |
| Restrictions: | - |
Preise für dieses Bild ab 15 €
Universitäten & Organisationen
(Informationsmaterial Digital, Informationsmaterial Print, Lehrmaterial Digital etc.)
ab 15 €
Redaktionell
(Bücher, Bücher: Sach- und Fachliteratur, Digitale Medien (redaktionell) etc.)
ab 30 €
Werbung
(Anzeigen, Aussenwerbung, Digitale Medien, Fernsehwerbung, Karten, Werbemittel, Zeitschriften etc.)
ab 55 €
Handelsprodukte
(bedruckte Textilie, Kalender, Postkarte, Grußkarte, Verpackung etc.)
ab 75 €
Pauschalpreise
Rechtepakete für die unbeschränkte Bildnutzung in Print oder Online
ab 495 €