Toast,thermogram
Bildnummer 11832661
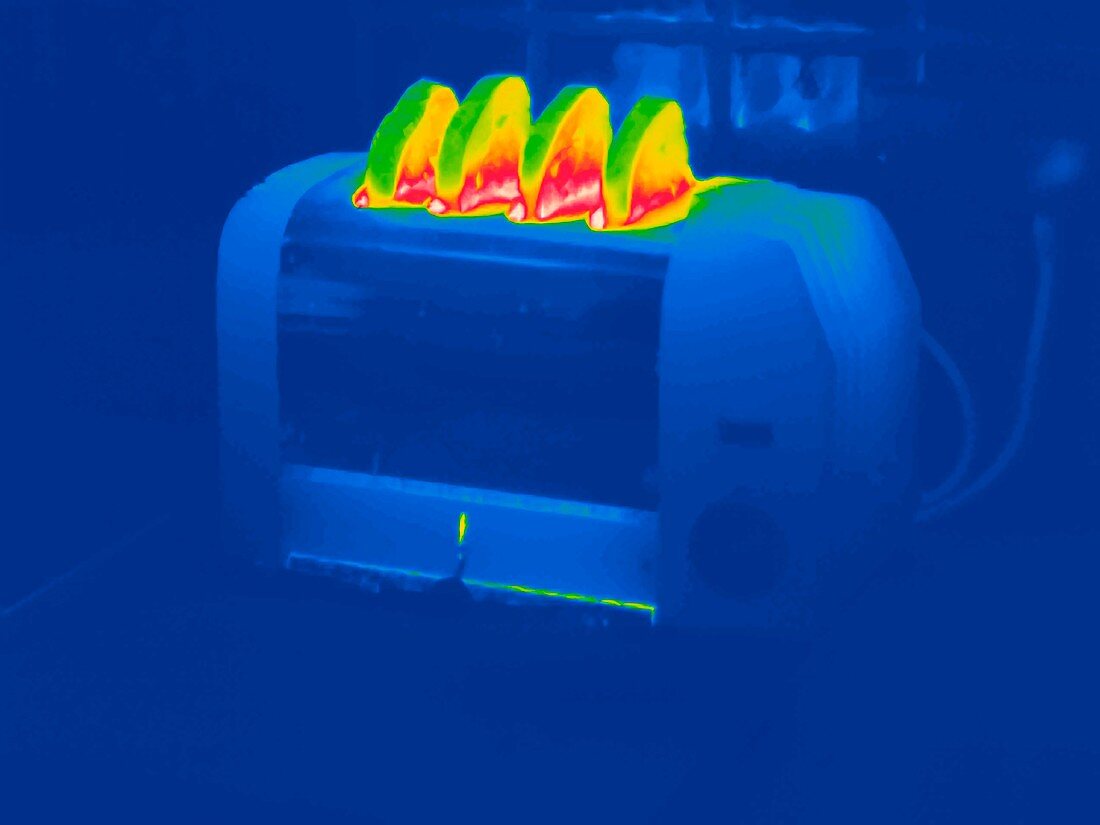
| Toast. Thermogram of toasted bread in an electric toaster. The colour-coding shows variations in temperature. The scale runs from white (warmest),through red,yellow and green to blue (coldest). Thermography records the temperature of surfaces by detecting long-wavelength infrared radiation. The heat of the toast contrasts with the cold of the casing of the toaster that insulates and retains the heat of the heating coils. A glow at bottom centre reveals a gap in this insulation. The top edges of the toast slices are colder than the side areas. This is because the coils heat the bread from the side | |
| Lizenzart: | Lizenzpflichtig |
| Credit: | Science Photo Library / McConnell, Tony |
| Bildgröße: | 4800 px × 3600 px |
| Modell-Rechte: | nicht erforderlich |
| Eigentums-Rechte: | nicht erforderlich |
| Restrictions: | - |
Preise für dieses Bild ab 15 €
Universitäten & Organisationen
(Informationsmaterial Digital, Informationsmaterial Print, Lehrmaterial Digital etc.)
ab 15 €
Redaktionell
(Bücher, Bücher: Sach- und Fachliteratur, Digitale Medien (redaktionell) etc.)
ab 30 €
Werbung
(Anzeigen, Aussenwerbung, Digitale Medien, Fernsehwerbung, Karten, Werbemittel, Zeitschriften etc.)
ab 55 €
Handelsprodukte
(bedruckte Textilie, Kalender, Postkarte, Grußkarte, Verpackung etc.)
ab 75 €
Pauschalpreise
Rechtepakete für die unbeschränkte Bildnutzung in Print oder Online
ab 495 €
Keywords
- Ausrüstung,
- Bild,
- Brot,
- Elektrisch,
- Fotografie,
- Gerät,
- Getoastet,
- heiß,
- Hitze,
- infrarot,
- Instrument,
- ir,
- isoliert,
- Isolierung,
- Kochen,
- Küche,
- Lebensmittel,
- Nahrungsmittel,
- Technik,
- Techniken,
- Technologie,
- technologisch,
- Temperatur,
- Thermografie,
- Thermogramm,
- Thermograph,
- Toast,
- Toaster,
- Vorbereitung,
- Warm,
- Werkzeug,
- Wissenschaft,
- wissenschaftlich