Making tea,thermogram
Bildnummer 11832659
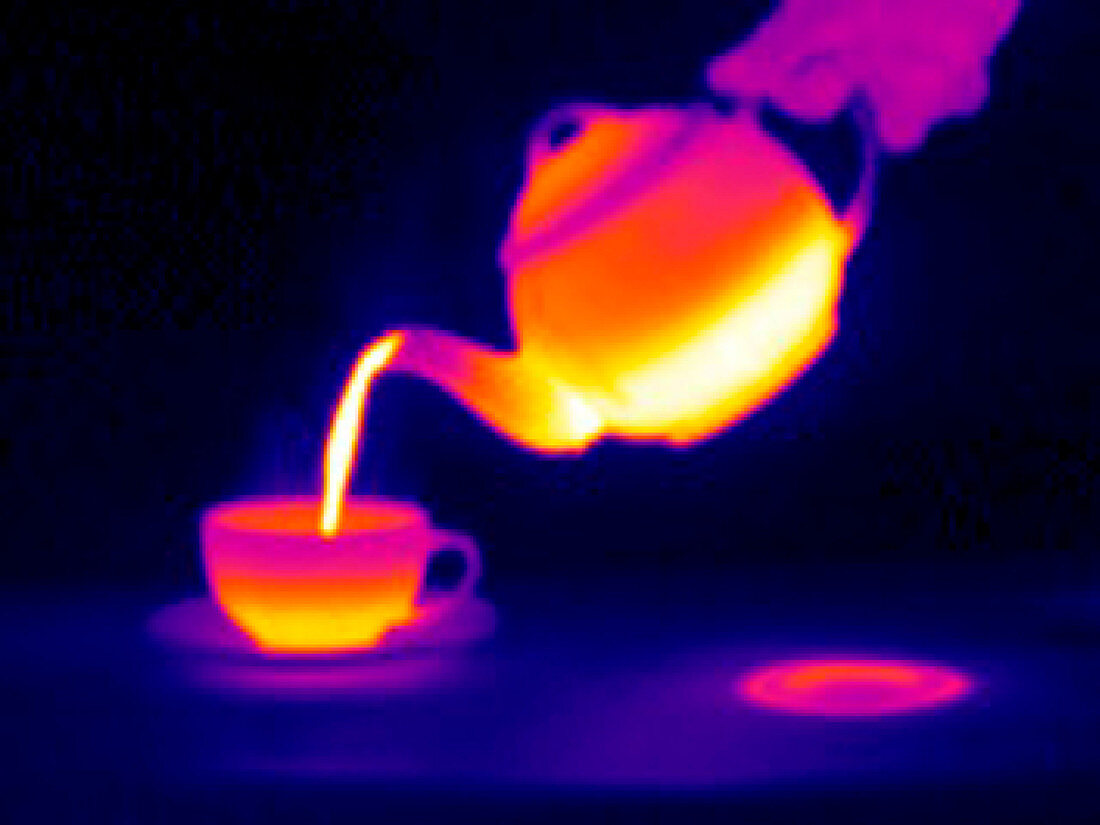
| Making a cup of tea. Image 3 of 4. Thermogram of a hand pouring tea from a teapot into a cup. The colours show variations in temperature. The scale runs from white (warmest),through yellow,orange,red and purple to blue (coldest). Thermography records the temperature of surfaces by detecting long-wavelength infrared radiation. The heat of the boiling tea is seen inside the teapot and also transferring heat to the cup. The teapot has also left a heat shadow where it rested on the surface at lower right. The handles of the cup and teapot remain cool due to little contact with the hot surfaces. For a sequence of thermograms showing a cup of tea being made,see images H584/103-106 | |
| Lizenzart: | Lizenzpflichtig |
| Credit: | Science Photo Library / McConnell, Tony |
| Bildgröße: | 3533 px × 2650 px |
| Modell-Rechte: | nicht erforderlich |
| Eigentums-Rechte: | nicht erforderlich |
| Restrictions: | - |
Preise für dieses Bild ab 15 €
Universitäten & Organisationen
(Informationsmaterial Digital, Informationsmaterial Print, Lehrmaterial Digital etc.)
ab 15 €
Redaktionell
(Bücher, Bücher: Sach- und Fachliteratur, Digitale Medien (redaktionell) etc.)
ab 30 €
Werbung
(Anzeigen, Aussenwerbung, Digitale Medien, Fernsehwerbung, Karten, Werbemittel, Zeitschriften etc.)
ab 55 €
Handelsprodukte
(bedruckte Textilie, Kalender, Postkarte, Grußkarte, Verpackung etc.)
ab 75 €
Pauschalpreise
Rechtepakete für die unbeschränkte Bildnutzung in Print oder Online
ab 495 €
Keywords
- Bild,
- Fotografie,
- Getränk,
- Gießen,
- Hand,
- heiß,
- Herstellung,
- Hitze,
- infrarot,
- ir,
- Keramik,
- Reihenfolge,
- Schatten,
- Tasse,
- Technik,
- Techniken,
- Technologie,
- Tee,
- Teekanne,
- Temperatur,
- Thermografie,
- Thermogramm,
- Thermograph,
- Topf,
- Untertasse,
- vorbereitend,
- Vorbereitung,
- Warm,
- Wasser,
- Wissenschaft,
- wissenschaftlich