Baked gingerbread,thermogram
Bildnummer 11832652
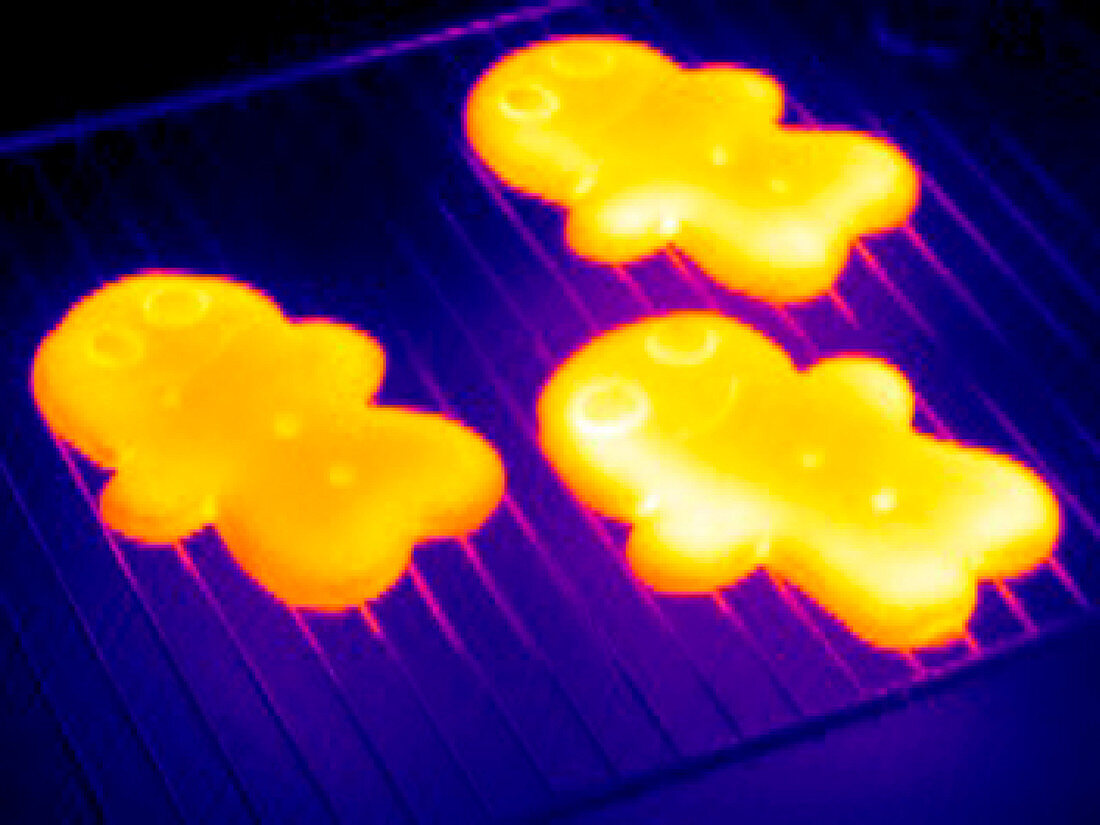
| Baked gingerbread. Thermogram of gingerbread men cooling on a rack after being baked. The colours show variations in temperature. The scale runs from white (warmest),through yellow,orange,red and purple to blue (coldest). Thermography records the temperature of surfaces by detecting long- wavelength infrared radiation | |
| Lizenzart: | Lizenzpflichtig |
| Credit: | Science Photo Library / McConnell, Tony |
| Bildgröße: | 3533 px × 2650 px |
| Modell-Rechte: | nicht erforderlich |
| Eigentums-Rechte: | nicht erforderlich |
| Restrictions: | - |
Preise für dieses Bild ab 15 €
Universitäten & Organisationen
(Informationsmaterial Digital, Informationsmaterial Print, Lehrmaterial Digital etc.)
ab 15 €
Redaktionell
(Bücher, Bücher: Sach- und Fachliteratur, Digitale Medien (redaktionell) etc.)
ab 30 €
Werbung
(Anzeigen, Aussenwerbung, Digitale Medien, Fernsehwerbung, Karten, Werbemittel, Zeitschriften etc.)
ab 55 €
Handelsprodukte
(bedruckte Textilie, Kalender, Postkarte, Grußkarte, Verpackung etc.)
ab 75 €
Pauschalpreise
Rechtepakete für die unbeschränkte Bildnutzung in Print oder Online
ab 495 €
Keywords
- Backen,
- Bild,
- Dessert,
- Drei,
- Fotografie,
- Gebacken,
- Gestell,
- Gewürz,
- heiß,
- Hitze,
- infrarot,
- Ingwer,
- ir,
- Keks,
- Kekse,
- Kochen,
- Kühlung,
- Lebensmittel,
- Lebkuchen,
- Mann,
- Männer,
- Nahrungsmittel,
- Snack,
- süss,
- Technik,
- Techniken,
- Technologie,
- Temperatur,
- Thermografie,
- Thermogramm,
- Thermograph,
- Traditionell,
- Trio,
- Warm,
- Wissenschaft,
- wissenschaftlich