Thermogram of fire
Bildnummer 11832647
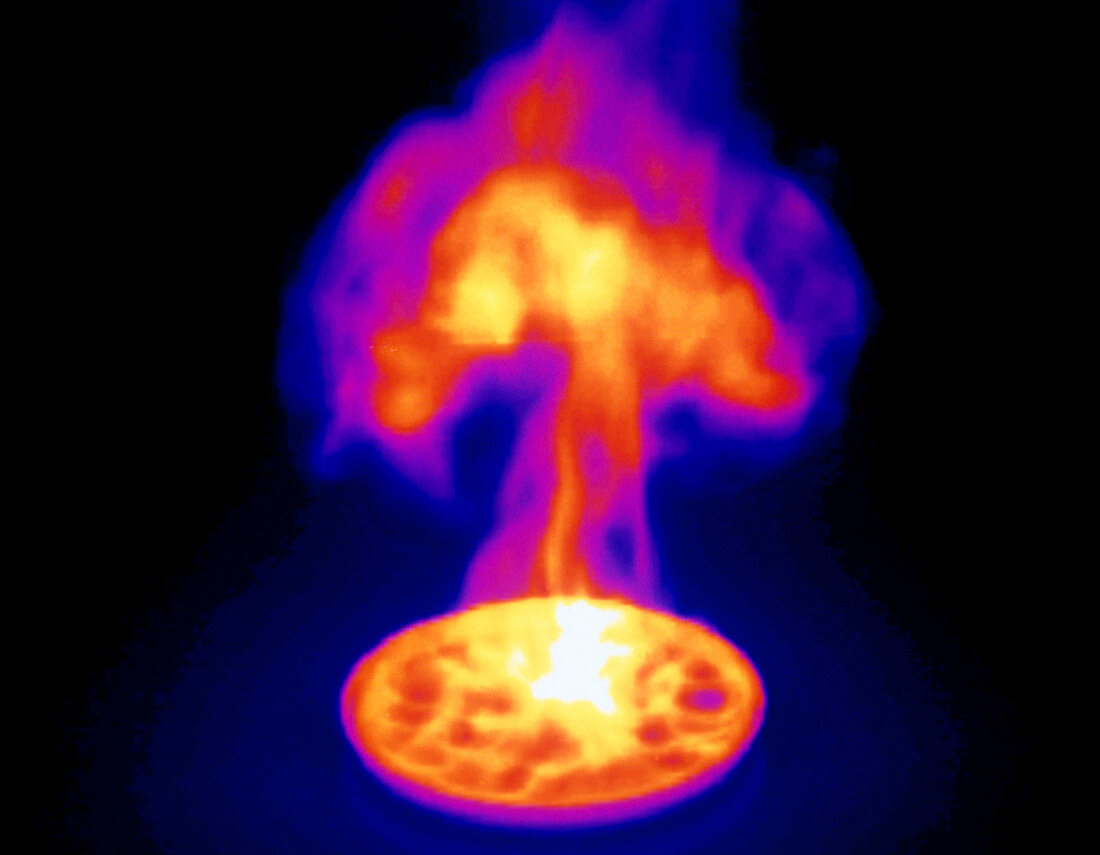
| Fire. Thermogram of a fire during research into new fire-detection techniques. Temperature is colour-coded,running from white (hottest) to blue (coolest). This image shows the chaotic structure of fire,with dense hot spots separated by cooler gullies. Such features make flames unpredictable and difficult to model,but are the basis of new detection systems. These measure temperature fluctuations and smoke density and use "fuzzy logic" to distinguish uncontrolled fires from flashing lights and even candles. This reduces false alarms. Research for the Cerberus AlgoRex system from Siemens AG,based in Switzerland | |
| Lizenzart: | Lizenzpflichtig |
| Credit: | Science Photo Library / Steger, Volker / Siemens |
| Bildgröße: | 4724 px × 3671 px |
| Modell-Rechte: | nicht erforderlich |
| Eigentums-Rechte: | nicht erforderlich |
| Restrictions: | - |
Preise für dieses Bild ab 15 €
Universitäten & Organisationen
(Informationsmaterial Digital, Informationsmaterial Print, Lehrmaterial Digital etc.)
ab 15 €
Redaktionell
(Bücher, Bücher: Sach- und Fachliteratur, Digitale Medien (redaktionell) etc.)
ab 30 €
Werbung
(Anzeigen, Aussenwerbung, Digitale Medien, Fernsehwerbung, Karten, Werbemittel, Zeitschriften etc.)
ab 55 €
Handelsprodukte
(bedruckte Textilie, Kalender, Postkarte, Grußkarte, Verpackung etc.)
ab 75 €
Pauschalpreise
Rechtepakete für die unbeschränkte Bildnutzung in Print oder Online
ab 495 €